Business Visualizations

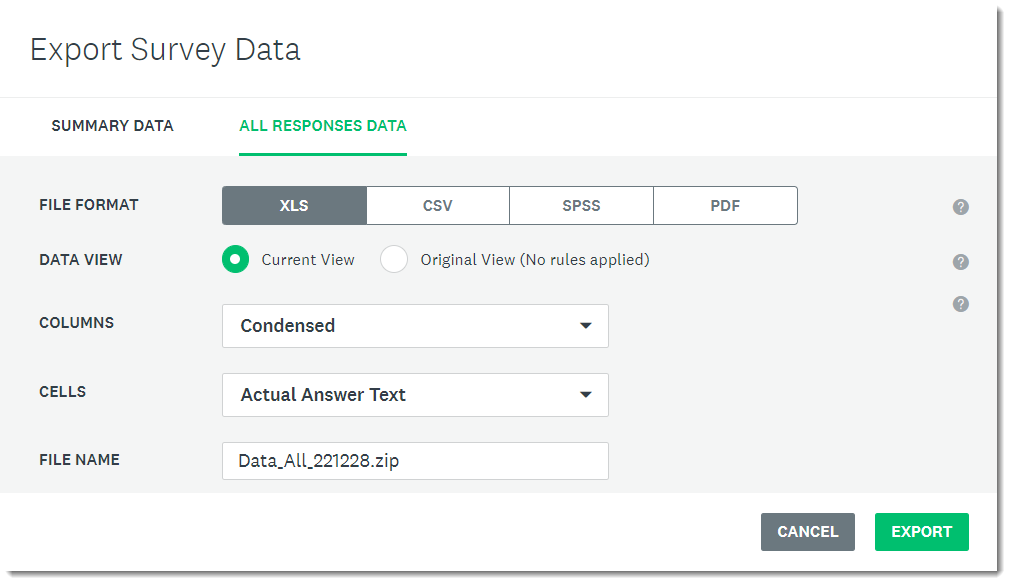
Getting SurveyMonkey data to play nicely with Tableau

By |2023-01-04T17:11:55+00:00January 3rd, 2023|Business Visualizations, Visualizing Survey Data|

I’ve received a lot of requests to address the unique (and annoying) issues with getting SurveyMonkey data to play nicely with Tableau. The good news is that once you know where the stumbling blocks are it’s not very difficult to get your data “just so” so that you can create clear visualizations that provide solid [...]

Laying off Twitter for a Week

By |2022-12-14T20:15:33+00:00December 14th, 2022|Business Visualizations, General Discussions, Health and Social Issues|

Where and how to have discussions around data visualization From December 5 through 9, I took a break from Twitter to spark conversation on The Data Visualization Society’s Slack workspace. I want to thank the dozens of colleagues who joined me for this experiment as we needed, and got, a critical mass of participants. [...]

Some people to follow

By |2022-09-21T23:14:37+00:00September 21st, 2022|Business Visualizations, General Discussions|

I subscribe to a lot of newspapers and magazines (some of which I read), but to satisfy my interest in data visualization, I find the best information often comes from people I follow on Twitter and from newsletter subscriptions. I’ll confess that I’m surprised at how many good conversations I see about data visualization on [...]

Do you really need to fly for business?

By |2022-09-21T17:34:49+00:00September 6th, 2022|Business Visualizations, General Discussions, Health and Social Issues|

As people who read my newsletter or attend Chart Chat know, I was one of the volunteers who contributed to The Carbon Almanac. I also subscribe to the Carbon Almanac daily newsletter (it’s excellent). Here’s what came in the other day. I used to travel a lot to give public and private workshops. Then the [...]

Title