Note: This post is very dated. Please see the YouTube video from the Tableau 2014 conference and the Visualizing Survey Data page for more up-to-date information.
Overview
In my previous blog post I discussed how to reshape your survey data so that it plays nicely with Tableau. In this post we’ll explore how to visualize three types of survey questions:
- Yes / No / Maybe
- Check-All-That-Apply
- Likert Scale
Note: A fully working collection of interactive visualization may be found at the end of this blog post.
Connecting to the Data
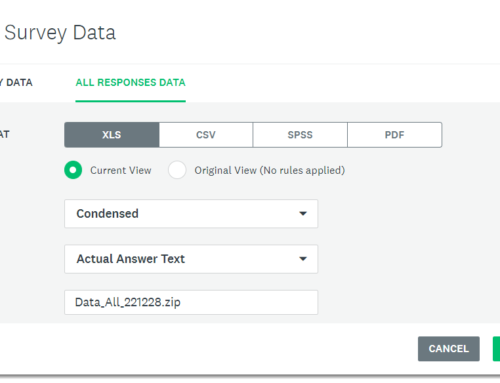
We need to connect to the reshaped data source we created in Part 1. For those of you that are following along and downloaded the sample data, there are several tabs in the source Excel file. Make sure you connect to the one marked “Use This One” as shown below.

Connecting to the right data source
When asked how you want to connect to the data, select “Import all data”.

You’ll be happier if you import all the data and let Tableau create an extract
There are two reasons for doing this:
- With larger data sets your performance will be much faster; and,
- You will need Tableau’s COUNTD() function and that is not available when you connect directly to Excel (or Access, for that matter.)
Your dimensions and measures shelves should look like the one shown here.

Default Dimensions and Measures
Note that the ID “Measure” should in fact be a Dimension, so when you get a chance, drag the field up to the Dimensions shelf.
So, just who are these people?
Before visualizing any questions I like to get a sense of who participated in the survey. I’ll start by looking at Gender.

Start by getting a feel for who answered the survey questions
Notice that I place COUNTD(ID) on the columns shelf indicating that I want to count the number of unique. Had I used the regular COUNT() function I would count all of the rows that contain a respondent’s ID, and that is a large number given how we’ve reshaped the data.
The “Null” value indicates that some people chose not to respond to this demographic question. I suggest creating an alias called “Did not respond” to handle these non-responses.
From here I will create views for any other demographic groups (e.g., Generation, Location, etc.).
Visualizing a Yes / No / Maybe question
Let’s start by seeing what questions are available by placing Question on the Rows shelf.

With reshaped data there’s only one field, but many questions
As you may recall from the previous blog post, our sample survey contained the question “Do you plan to vote in the upcoming election?” for which there were three possible responses (“Yes”, “No”, and “I don’t know.”)
As I’m not interested in all the questions in the survey I need to add a filter that just keeps the first question in the list.
To see preliminary results for this question I will place “Response” on the rows shelf and COUNTD(ID) on the columns shelf. While not particularly pretty, it does show us something useful.

Preliminary results
I will next alias the Question (and Responses), sort the Responses, and place Response on the color shelf. I will also add a table calculation to the Columns shelf so that instead of showing a count we show the percentage of the total.

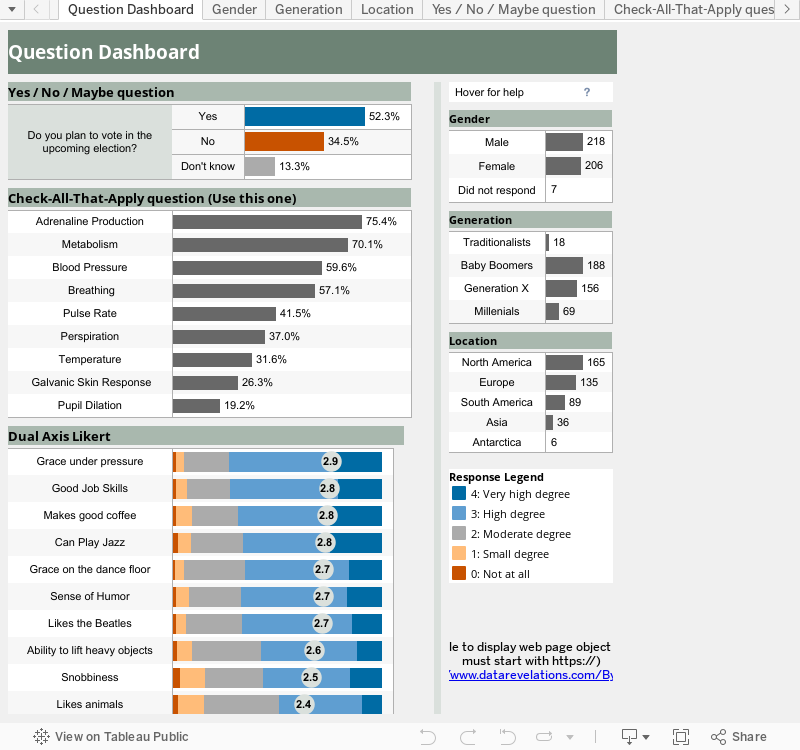
A simple, clear visualization
Now we’re talking!
The nice thing about the way we have this set up is that it’s easy to break down the results by our demographic segments simply by dragging a dimension to either the rows or column shelf, as shown below.

Results broken down by generation
Check-All-That-Apply Questions
To get a sense of what we have going on for this question I duplicated the sheet from the previous visualization and then changed the Question filter so that I’m looking at the check-all-that-apply questions. Here are the filter settings.

Selecting questions using a filter
Do you now see the major advantage of having reshaped the data? Had I kept the one column / one question approach I would have to use Tableau’s Measure Name / Measure Names feature and I would likely have to build a separate calculated field for every question I want to analyze. With reshaped data I just put Question on the Rows shelf and filter by the questions I want to analyze.
Tip: I will usually create a set for each question grouping I want to review, sort of a “named filter”, as it were. In the accompanying workbook you will find two sets, one called “Check All That Apply” and the other called “LikertQuestions”. You can then drag either of these sets to the filter shelf.
Here’s the resulting visualization.

A bad way to show check-all-that-apply results
Well, it’s a start, but it’s a not a a very good visualization. For one thing, I only care about the percentage of people that selected “yes”; I don’t even need to consider the “no” folks.
I need to fashion a formula that counts of how many “yes” responses there were for each question, then divide by the number of responses. This would be simple of the responses for these questions were 1 and 0, but unfortunately the responses are labels that look like this:
1: Yes
0: No
So, I need to perform a little string arithmetic. The calculated field that does what we want is shown here.
SUM(
IIF (Left([Response],1)="1" ,1,0)
)
/SUM([Number of Records])
And a visualization that employs this formula is shown here.

A better way to show check-all-that-apply results
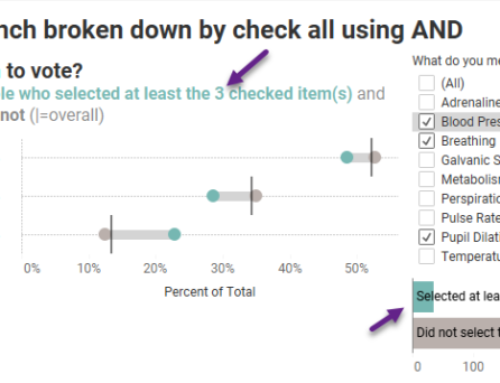
That’s much better. And of course, I can add a demographic dimension to glean additional insights. In the screen below I show a comparison between male and female respondents, using an overlapping bar chart.

Check-all-that-apply question, broken down by gender
Likert Scale Questions
Note: Before continuing, you must promise that upon reading the rest of this blog post you read the following two blog posts:
https://www.datarevelations.com/the-likert-question-question.html
https://www.datarevelations.com/likert-scales-the-final-word.html
You promise?
Okay, since you promised…
As with the previous two question types, the first things I need to do is place “Question” on the filters shelf and select the group of questions we want to analyze in this visualization:

Using a filter to select the Likert scale questions
Now I’ll create a stacked bar chart, by placing “Question” on the Rows shelf, CNTD(ID) on the Columns shelf, and response on the Color shelf.

First pass at Likert Scale viz
Next I need to replace the CNTD(ID) measure with a table calculation that shows the percent of the total based on Response.

Adding percent of total to the viz
Since the questions are sorted in alphabetical order it’s hard to gauge which questions garner the greatest amount of agreement. This is where using the Likert scores (4 for “Very high degree”, 3 for “High degree”, etc.) can help add clarity.
While I go into much greater detail in the two blog posts YOU PROMISED TO READ, I’ll walk you through how to calculate the average Likert score and superimpose if atop the stacked bars.
In our example, the value I need is the first character in the Response string, so we just need to grab the left-most character and convert it into a number. I can do that using the following calculated field called LikertValue.
Float(Left([Response],1))
Next, I’ll place the Average of this calculated field on the Columns shelf next to the existing table calculation (don’t worry that the result will not look good.) I now need to indicate that we have multiple marks and make the first chart a Bar chart and the second a Circle chart, as shown here.

As is often the case, as you first make improvements you can get some wacky results
This still looks pretty dumb, but if I remove “Response” from the Color shelf, then right-click AVG(LikertValue) on the columns shelf and select “Dual Axis” we get something that starts to be useful.

Getting close…
Finally, if I show labels for the circle chart and sort the questions by Average LikertValue we get something that tells a clear story.

Not too shabby
Conclusion
In this and the accompanying blog post we’ve explored how to reshape survey data and visualize three different types of survey question. Granted, there are other question types (e.g., “add up to 100”, “rank these in order”, etc.) as well as intra-question analysis (e.g., create a scatterplot showing respondent’s age vs. annual income) that are a bit trickier to implement, but what we’ve delved into here should cover a wide variety of needs.