Before I share some of the modern retellings of the Minard Chart, here is a superb video on the subject by Robert Kosara. If nothing else, you’ll learn what the term hapax legomenon means.
Norbert Landsteiner, who has done a lot of research on this visualization (and who I cite in The Big Picture) has also developed an interactive version of the chart that you can find here.
Here is take on the data from MakotoRK using Plotly Chart Studio.
TASS, the Russian News Agency, produced this amazing interactive narrative.
. . .
 As I write in The Big Picture, I don’t think you will ever have a use for a chart like this one in a modern business context.
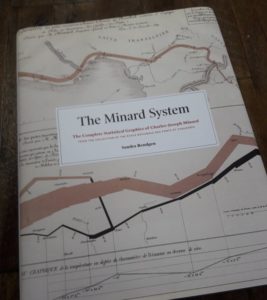
But there are some Minard charts that I think are applicable to work today. I encourage you to read a copy of Sandra Rendgen’s excellent The Minard System.


