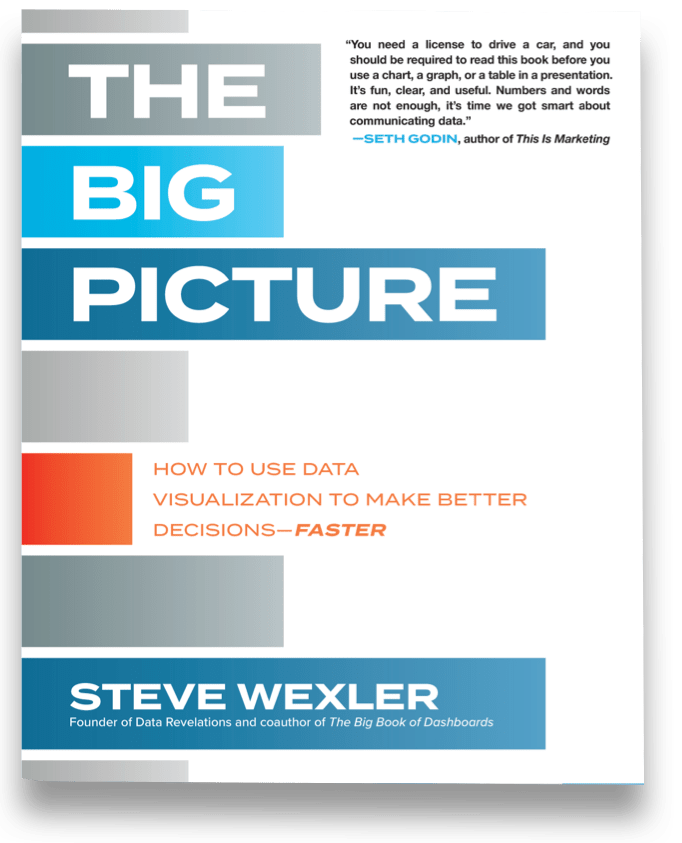
“You need a license to drive a car, and you should be required to read this book before you use a chart, a graph, or a table in a presentation. It’s fun, clear, and useful. Numbers and words are not enough, it’s time we got smart about communicating data.”
—SETH GODIN, author of This Is Marketing

“Steve Wexler’s graphs are vivid, funny, practical, and highly informative—and so is this book.”
—TIM HARFORD, bestselling author of The Undercover Economist and The Data Detective

“Steve Wexler has done for data visualization what Dale Carnegie did for the art of making friends and influencing people, and Strunk and White did for writing. The Big Picture helps professionals at every level of an organization master the fundamentals and develop better “maps” that lead to better strategies.”
—JOHN C. PITTENGER, former SVP of Corporate Strategy for Koch Industries, Inc.

“You need this book. Data visualization is the key to sifting through the onslaught of numbers in our professional lives, and Steve Wexler gives incisive, practical advice on how to derive deeper insight and understanding from data more quickly. With his infectious love of making data accessible, Wexler enables us to see things differently, inspiring us to ask even better questions.”
—JON COHEN, Chief Research Officer of SurveyMonkey

“Every business leader will benefit from the wisdom in this book. The Big Picture is an essential guide that shortens the time it takes to come to a deeper understanding of your data. Leveraging visuals that truly illuminate insights—and avoid misleading representations—helps organizations be more agile in their decision-making. Every business leader I know wants to make better decisions faster. This invaluable tool will get you there. —KENDALL CROLIUS, President of G100 Next Generation Leadership If a picture is worth a thousand words, then The Big Picture is worth a million dollars. It will enable business leaders to see patterns in data with the least amount of effort, uncovering opportunities and galvanizing action. Indispensable!”
—BRAD EPSTEIN, Chief Marketing Officer of Precision Medicine Group

“Steve Wexler’s passion for reducing the time to the actionable insights is inspiring, and I came away with new tools to transform data into intelligence and impact. The Big Picture is a quick read, and Wexler doesn’t get bogged down in theory, but instead uses his arsenal of real-life examples to illustrate his points. I will be sharing this book and its many lessons with my entire organization!”
—MOLLY SCHMIED, Chief Analytics Officer at the Office of Advancement of The Ohio State University

“Illustrated with a vast array of examples and real-world case studies, The Big Picture is a practical primer on data visualization designed to help business professionals achieve a clearer comprehension of dashboards and graphs—and how to use them to change minds. Steve Wexler’s smart and humorous approach makes for an enlightening and entertaining read.”
—COLE NUSSBAUMER KNAFLIC, founder and CEO of storytellingwithdata.com and bestselling author of Storytelling with Data

“Data analytics is becoming ubiquitous—but to truly be data driven, businesses must embrace a data culture in which analytics are used democratically and holistically. The Big Picture offers essential data literacy lessons necessary for informed, intelligent
conversations about data.”
—ADAM SELIPSKY, President and CEO of TableauYour Content Goes Here

The Big Book of Dashboards

on Amazon
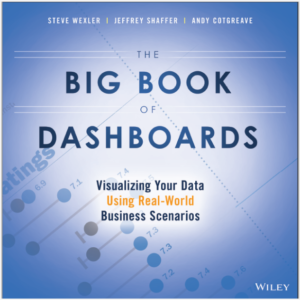
Comprising dozens of examples that address different industries and departments (healthcare, transportation, finance, human resources, marketing, customer service, sports, etc.) and different platforms (print, desktop, tablet, smartphone, and conference room display) The Big Book of Dashboards is the only book that matches great dashboards with real-world business scenarios.

The Big Book of Dashboards provides a solid treatment of the fundamentals of data visualization, but the numerous examples are what set this book apart. The comments from the authors after each chapter remind the reader that creating influential dashboards is both a science and an art. This book will spend more time on my desk than on my shelf―incredibly practical.”

Jeffrey Camm, Inmar Presidential Chair, Associate Dean of Business Analytics, Wake Forest School of Business, Amazon

“Some books about visualization focus on principles and guidelines, but they don’t devote enough pages to explain how to apply them to the design of complex, multi-section displays, like business dashboards. This book is the opposite of that. While the book contains an introduction to data visualization fundamentals, it is the numerous examples of real dashboards that sets it apart. If you’ve ever found yourself stuck when creating a dashboard, you will likely find a solution here.

Alberto Cairo, author of The Truthful Art: Data, Charts, and Maps for Communication, Amazon

“This book is full of beautiful dashboards along with uber-practical advice from three authors with many years of experience. It is a treasure chest for hardcore data-viz geeks and business leaders needing to get smart on how to present data to optimize operations.”

J.D. Whitlock, VP, Enterprise Intelligence, Mercy Health, Amazon

“This book provides you with a vast array of real-world dashboards, and shares the thoughts and considerations that have gone into each example. The authors even provide a full explanation that acts as a user guide. Mix and match these ideas, and you’ll find what you need to visualize your data.

J.D. Whitlock, VP, Enterprise Intelligence, Mercy Health, Amazon

About the Author(s)

Steve Wexler
Steve Wexler
Data Revelations
Steve has worked with ADP, Gallup, Johnson & Johnson, Deloitte, ExxonMobil, Convergys, Consumer Reports, The Economist, ConEd, D&B, Marist, Cornell University, Stanford University, Tradeweb, Tiffany, McKinsey & Company, and many other organizations to help them understand and visualize their data. Steve is a five-time Tableau Zen Master, Iron Viz Champion, and on the advisory board to the Data Visualization Society.
Jeffrey Shaffer
Jeffrey Shaffer
Data Plus Science
Jeffrey A. Shaffer is Vice President of Information Technology and Analytics at Recovery Decision Science and Unifund. He is also Adjunct Professor at the University of Cincinnati teaching Data Visualization where he was the 2016 Outstanding Adjunct Professor of the Year. He is a Tableau Zen Master, was the winner of the 2014 Tableau Quantified Self Visualization
Andy Cotgreave
Andy Cotgreave
Tableau Software
Andy Cotgreave is Technical Evangelist at Tableau Software. He joined Tableau in August 2011 and has had various roles at the company. In technical presales, he helped 100s of customers understand visual analytics. He worked with the training team to develop their first course on Visual Analytics. In 2013 he moved into product marketing to take on his new role

Get data visualization tips & news every month