The Big Picture: What Every Businessperson Needs to Know About Data Visualization
Whether you’re creating your own charts, using someone else’s, or you just need to be more confident in how to use and interpret graphs, this workshop will help you become fluent in the language of charts and dashboards.
Packed with great examples created in Excel, Tableau, Power BI, and Qlik, among others, this one-stop resource empowers you to extract the most important information from data visualizations quickly and accurately, act on key insights, solve problems, persuade others, and make the right decisions for your organization every time.
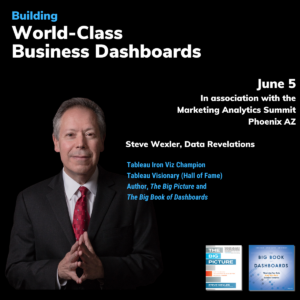
Building World-Class Business Dashboards
The workshop for creators is called Building World-Class Business Dashboards and it is based on my book The Big Book of Dashboards: Visualizing Your Data Using Real-World Business Scenarios.
A well-designed dashboard can point out risks, opportunities, and more; but common challenges and misconceptions can make your dashboard useless at best, and misleading at worst. This workshop will discuss the tools, guidance, and models you need to produce great dashboards that inform, enlighten, and engage.
Use the matrix below to decide which workshop is best for you.
| Person | The Big Picture | Building world-class business dashboards |
|---|---|---|
| Businesspeople who do not create charts and dashboards but need to draw insight from them | Yes | |
| People who are new to data visualization and will be tasked with creating charts, dashboards, and presentations | Yes | Yes |
| People who will be giving presentations and have a say on what charts should go in them (but will not be making the charts themselves) | Yes | |
| Intermediate to advanced graphic designers and dashboard designers | Yes | |
| People who manage data visualization practitioners and need to know the challenges they face | Yes | |
| Advanced practitioners who want help evangelizing data visualization in their organizations | Yes | |
| Workshop length | Half-day | Full-day or two half-days |

“Steve’s Dashboard class is the single best data training I’ve been to hands down! And I’ve been to Edward Tufte’s workshop. If you want to hit work the NEXT DAY with actionable learnings and enthusiasm, this is an incredible resource”

“This was genuinely one of the best workshops I’ve attended. Steve balanced his instruction with relevant and engaging examples and group exercises. Steve is clearly an expert at his craft, but he made those of us who are new to creating visualizations and dashboards feel comfortable. His follow up post-training has been phenomenal. His passion to educate the world on data visualization and to be of service to his audience is inspiring.”

“Steve’s workshop armed our team with the right tools to have meaningful discussions with our stakeholders and fostered an appreciation for how good data visualizations leads to better insights. Applying what we learned to our own work has been a game changer.“
Frequently Asked Questions


