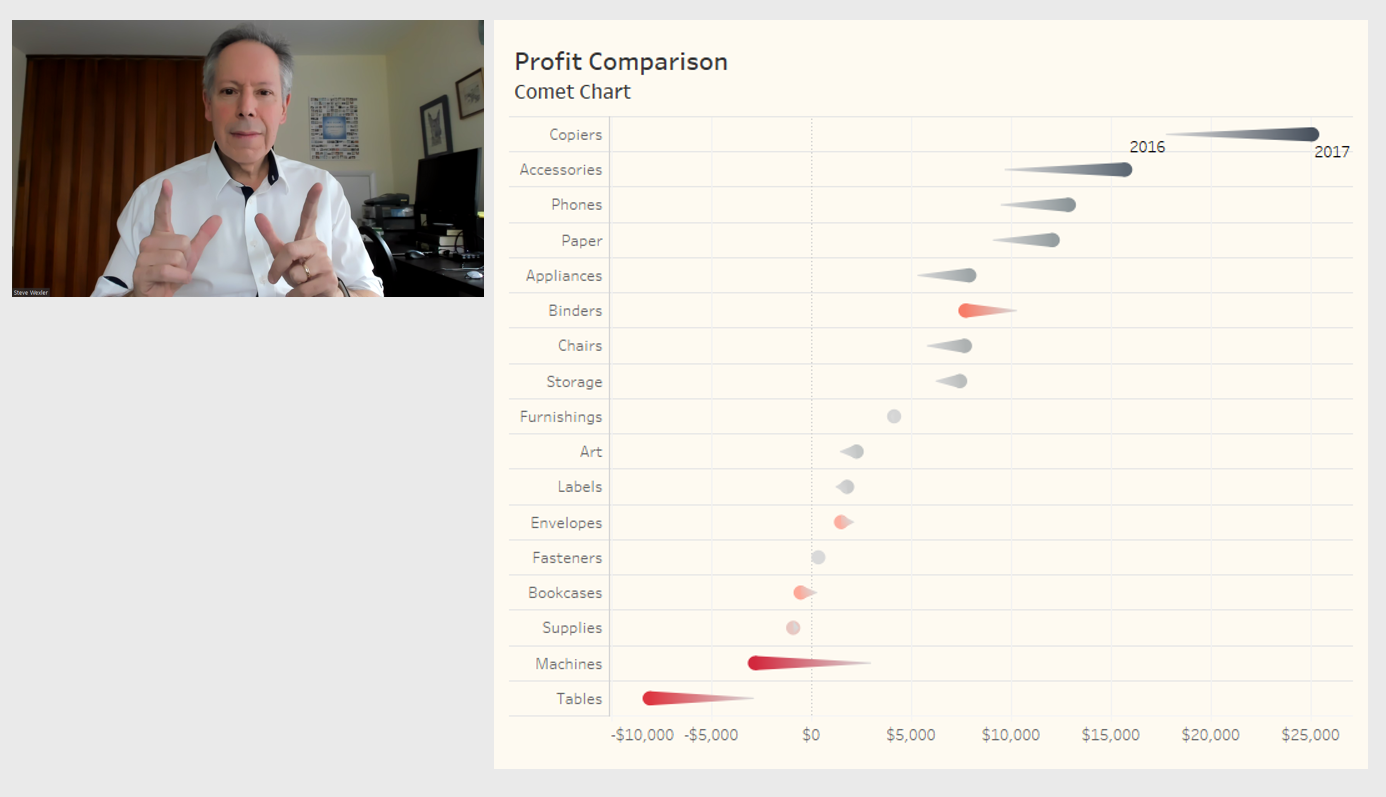
Many organizations don’t realize how much faster and more accurate their decision making would be if they were better at data visualization. Indeed, most organizations struggle with seeing and understanding their data. (Think about some of those 100-page slide decks and 60-column spreadsheets.)
In this live webinar, Tableau Zen Master and best-selling author Steve Wexler will share insights on how to get your organization to “get” data visualization.
Attend and learn:
- Why “just the numbers” isn’t good enough
- The “gateway drug” to data visualization
- Why do we see so many bar charts?
- Why most people make a mess of using color
- The secret to engaging your stakeholders and the power of disaggregated data
- What you should always, always, always keep in mind
If you’re new to data visualization, this webinar will help you understand the benefits of well-designed charts and dashboards. If you are experienced in data visualization, this webinar will help you evangelize its use in your organization.


