
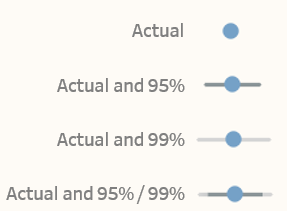
Showing uncertainty in survey results
Visual representation of error bars using Tableau August 20, 2018 Much thanks to Ben Jones whose book Communicating with Tableau provides the blueprint for the calculations I use, Jeffrey Shaffer for providing feedback on my prototypes and sharing research papers from Sönning, Cleveland, and McGill, and Daniel Zvinca for his thoughtful and always invaluable [...]

