A few of my favorite things from 2021
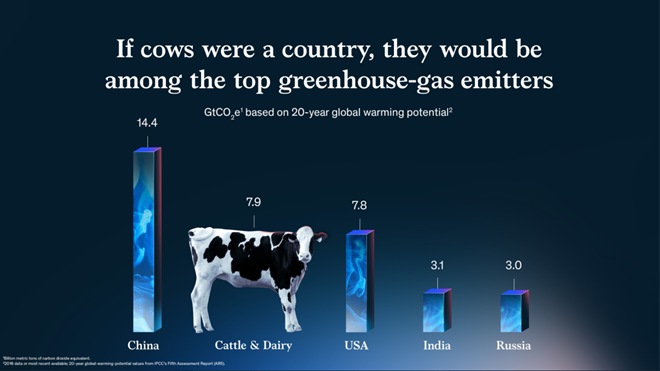
So many wonderful things from 2021. In this post I share my favorite chart, channel, chat, and tool. My favorite chart: If cows were a country I love this McKinsey gem from Jason Forrest, Gabrielle Merite, and Gergo Varga. I know, it violates so-called best practices. The bars are 3D (they look like smoke-filled containers) [...]