Webinar
Chart Chat Live — Round 20
Watch as Jeffrey Shaffer, Steve Wexler, Amanda Makulec, and Andy Cotgreave, debate the good, the bad, and the “scaredy-cats” of data visualization. By tuning in you’ll learn how to apply their thought processes to your own work. You’ll be entertained, and you’ll build better data visualizations. Register

Chart Chat Round 34 — October 13
Online NY, United StatesWatch as Jeffrey Shaffer, Steve Wexler, Andy Cotgreave, and Amanda Makulec debate the good, the bad, and the "scaredy-cats" of data visualization.

Chart Chat Round 35 — Novmeber 16
Online NY, United StatesWatch as Jeffrey Shaffer, Steve Wexler, Andy Cotgreave, and Amanda Makulec debate the good, the bad, and the "scaredy-cats" of data visualization.
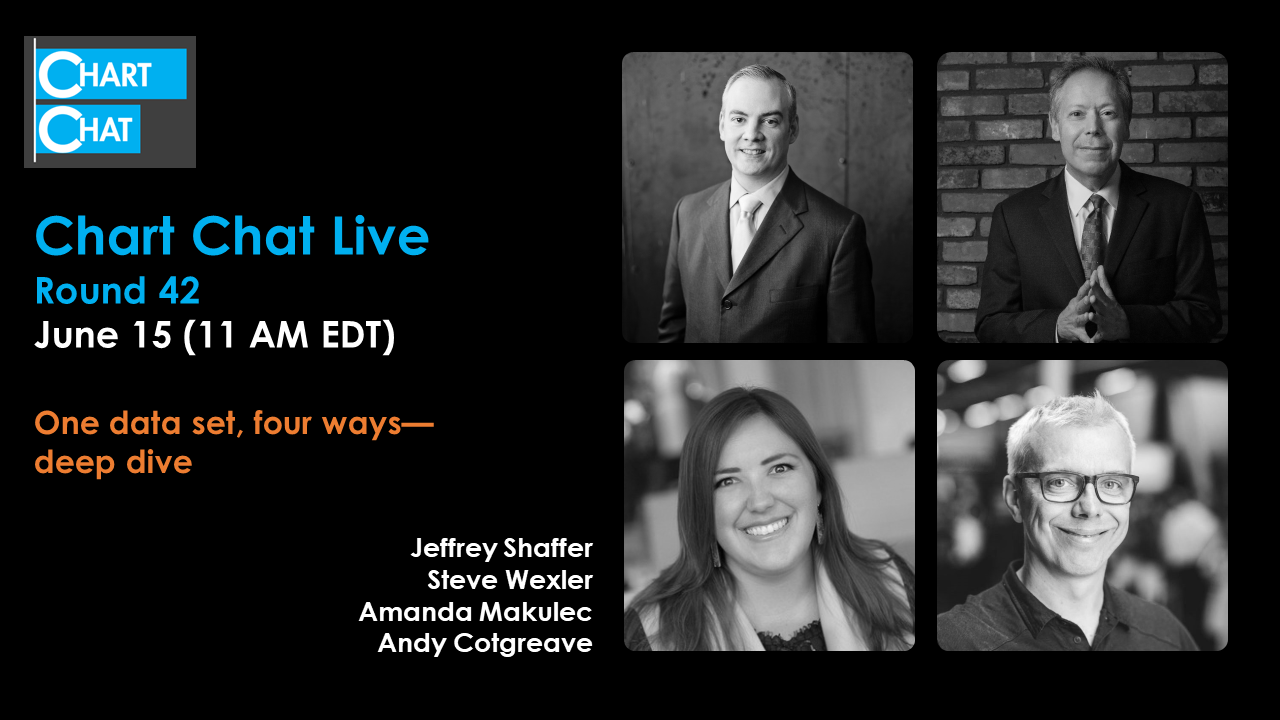
Chart Chat Round 42 — June 15
Online NY, United StatesWatch as Jeffrey Shaffer, Steve Wexler, Andy Cotgreave, and Amanda Makulec debate the good, the bad, and the "scaredy-cats" of data visualization.
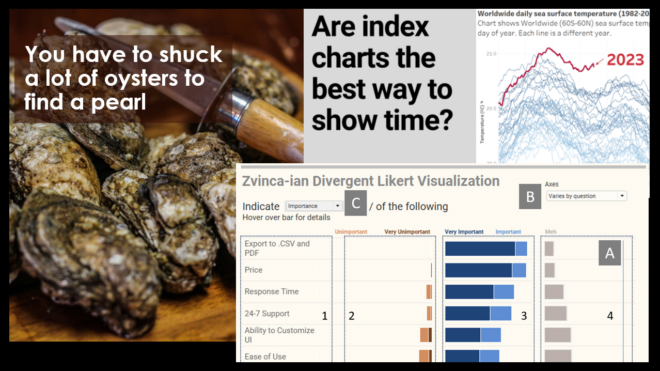
Chart Chat Round 43 — July 20
Online NY, United StatesWatch as Jeffrey Shaffer, Steve Wexler, Andy Cotgreave, and Amanda Makulec debate the good, the bad, and the "scaredy-cats" of data visualization.

Chart Chat Round 44 — September 21
Online NY, United StatesWatch as Jeffrey Shaffer, Steve Wexler, Andy Cotgreave, and Amanda Makulec debate the good, the bad, and the "scaredy-cats" of data visualization.
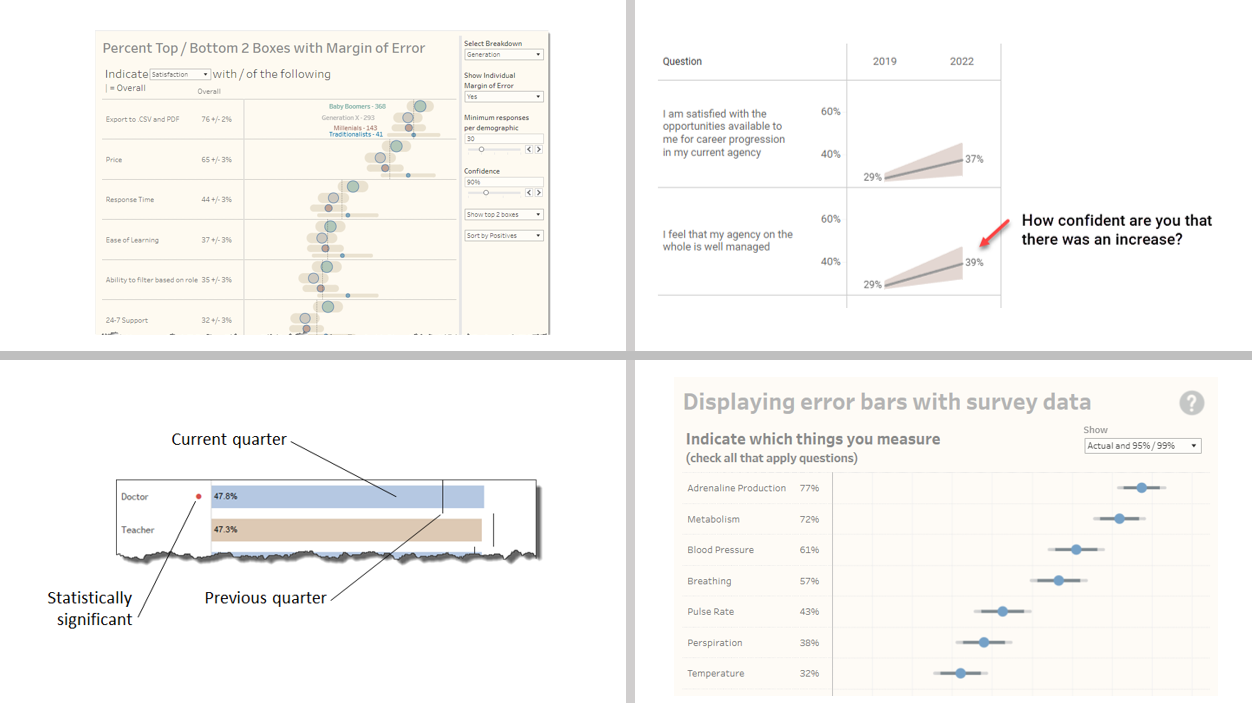
Visualizing Uncertainty in Survey Data
Online NY, United StatesLast month an attendee of my Visualizing Survey Data Using Tableau course asked me to explore showing confidence intervals / margin-of-error around longitudinal data. That is, he wanted his stakeholders to be able to see just what plus-or-minus X points looks like with respect to Likert responses over time. I get it. I’ve seen too many [...]
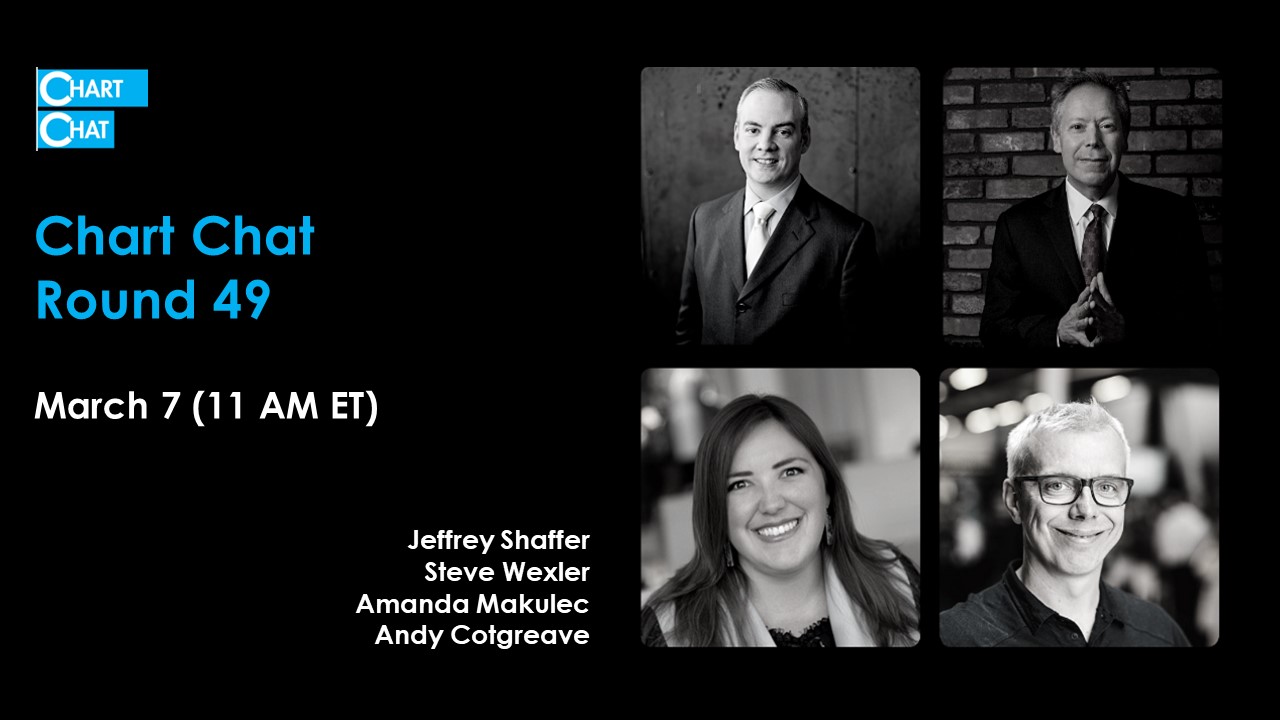
Chart Chat Round 49 — March 7
Online NY, United StatesWatch as Jeffrey Shaffer, Steve Wexler, Andy Cotgreave, and Amanda Makulec debate the good, the bad, and the "scaredy-cats" of data visualization.
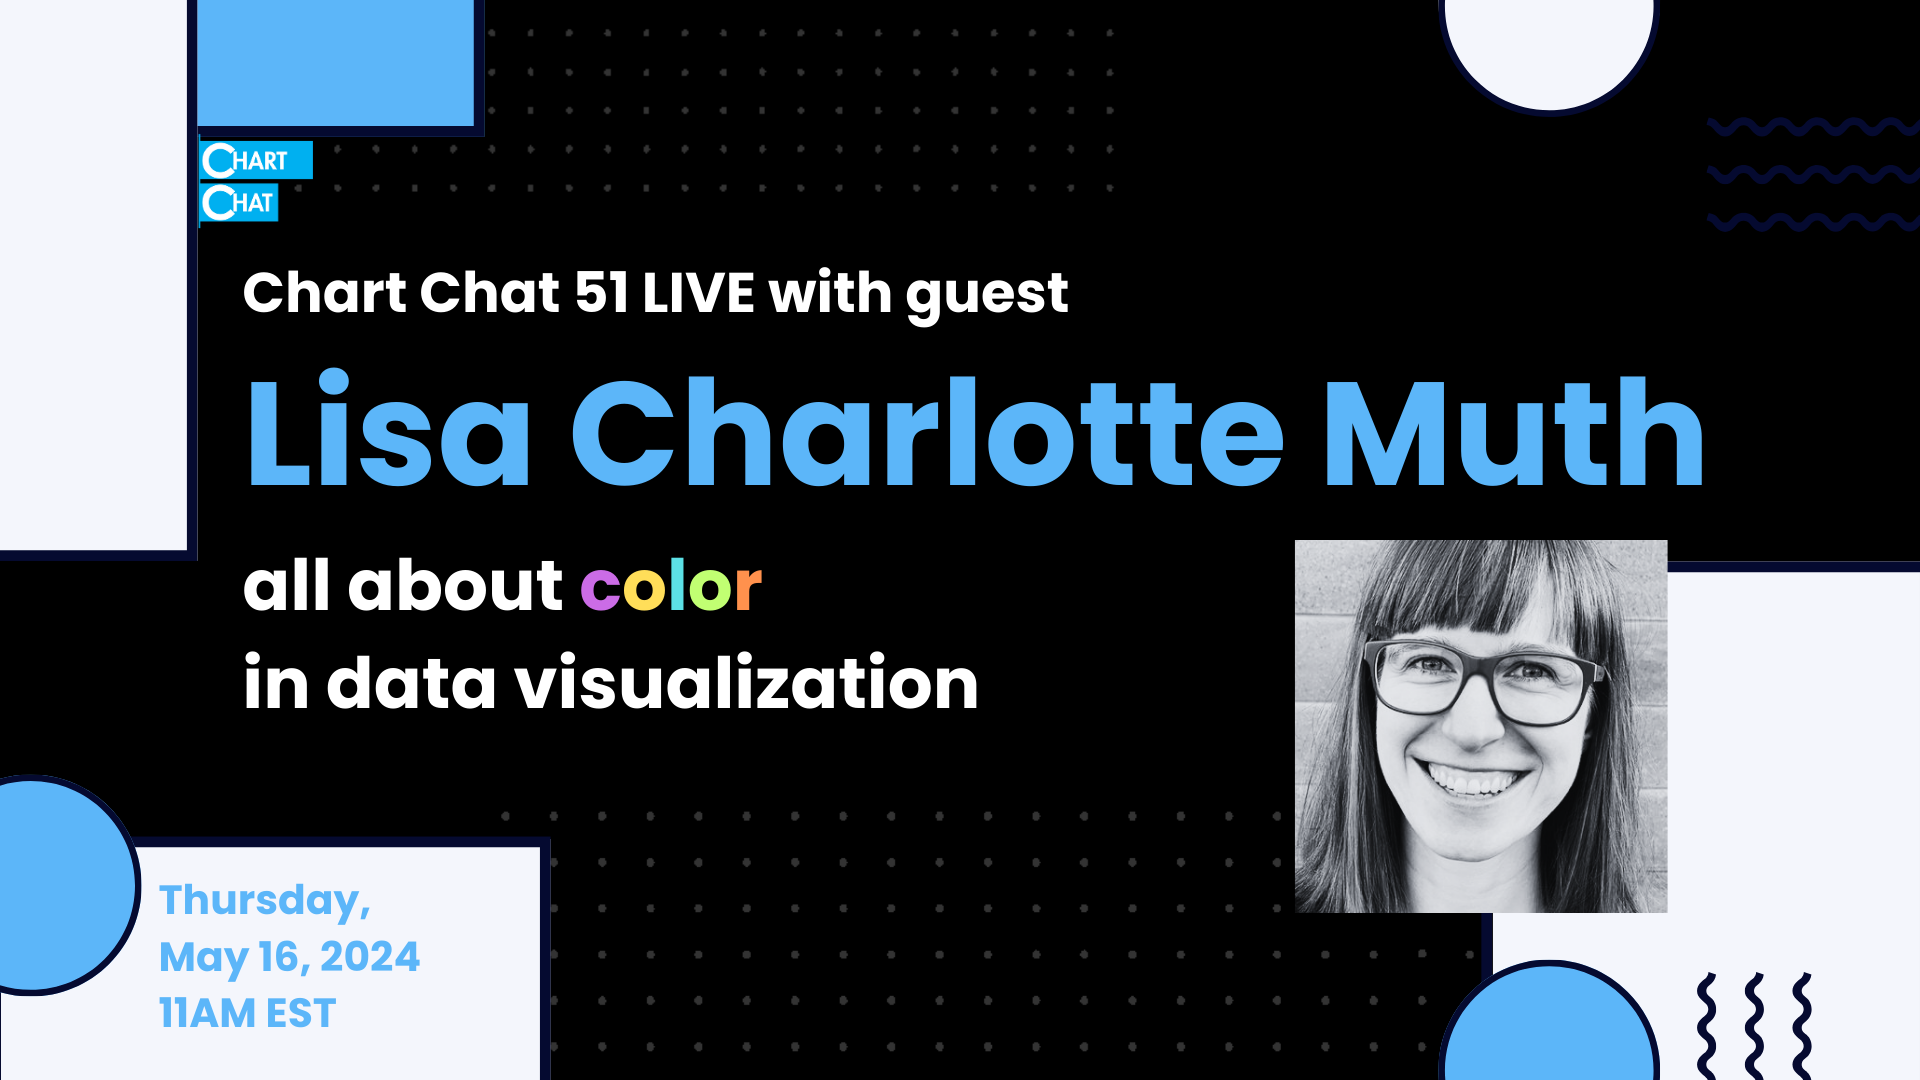
Chart Chat Round 51 — May 16
Online NY, United StatesWatch as Jeffrey Shaffer, Steve Wexler, Andy Cotgreave, and Amanda Makulec debate the good, the bad, and the "scaredy-cats" of data visualization.

Chart Chat Round 55 — October 23
Online NY, United StatesWatch as Jeffrey Shaffer, Steve Wexler, Andy Cotgreave, and Amanda Makulec debate the good, the bad, and the "scaredy-cats" of data visualization.


