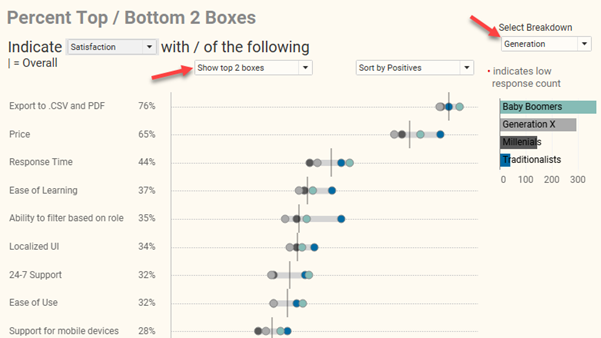
How to visualize Likert scale data broken down by different demographics
Overview September 6, 2021 update: A big thanks to Chris Lay and Daniel Zvinca who chimed in on a variety of issues, the most important of which is that the margin of error is very large with a low response count. I've added an option to hide marks where the number of responses is fewer [...]


