Understanding Index Charts and Log Scales
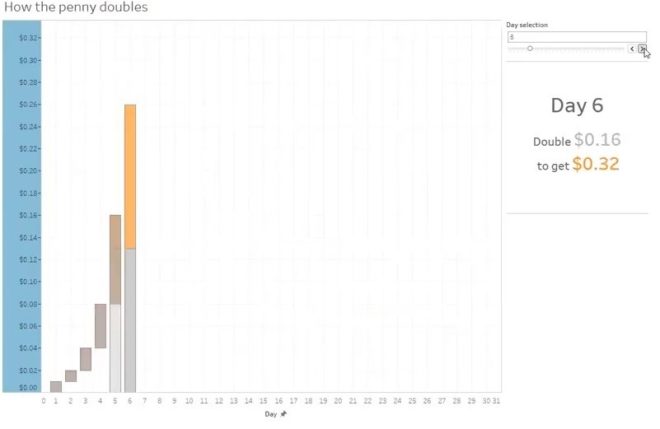
Understanding Index Charts and Log Scales https://youtu.be/Kzee9HyX6bU Index Charts are a great way to compare events that don't happen at the same time; for example, how are sales this quarter vs. last quarter, vs. a year ago this quarter? There are lots of business cases for this type of chart. What about log scales? [...]


