Australia / New Zealand Tableau User Group — Getting people to “get” data visualizaiton
Steve will share some of his favorite data visualization tips and tricks.

Steve will share some of his favorite data visualization tips and tricks.
Steve will share some of his favorite data visualization tips and tricks.
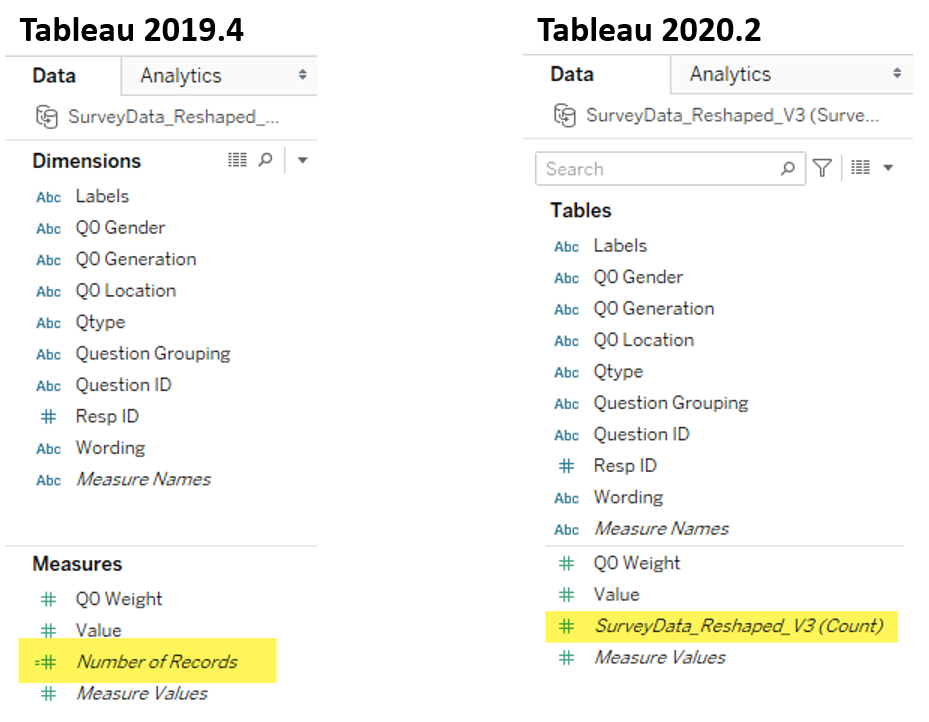
Overview I’ve written almost ten years’ worth of blog posts on visualizing survey data using Tableau (see https://www.datarevelations.com/visualizing-survey-data/). The good news is that dozens of how-to articles that are currently on my website are relevant and the techniques work. That said, Tableau made a HUGE change in how you can model data with the release [...]
In this live webinar, see real-world examples, free of esoteric chart types, that people employed to change the way their organizations did business.
In this live webinar, see real-world examples, free of esoteric chart types, that people employed to change the way their organizations did business.
In this live webinar, Tableau Zen Master and best-selling author Steve Wexler will share insights on how to get your organization to "get" data visualization.

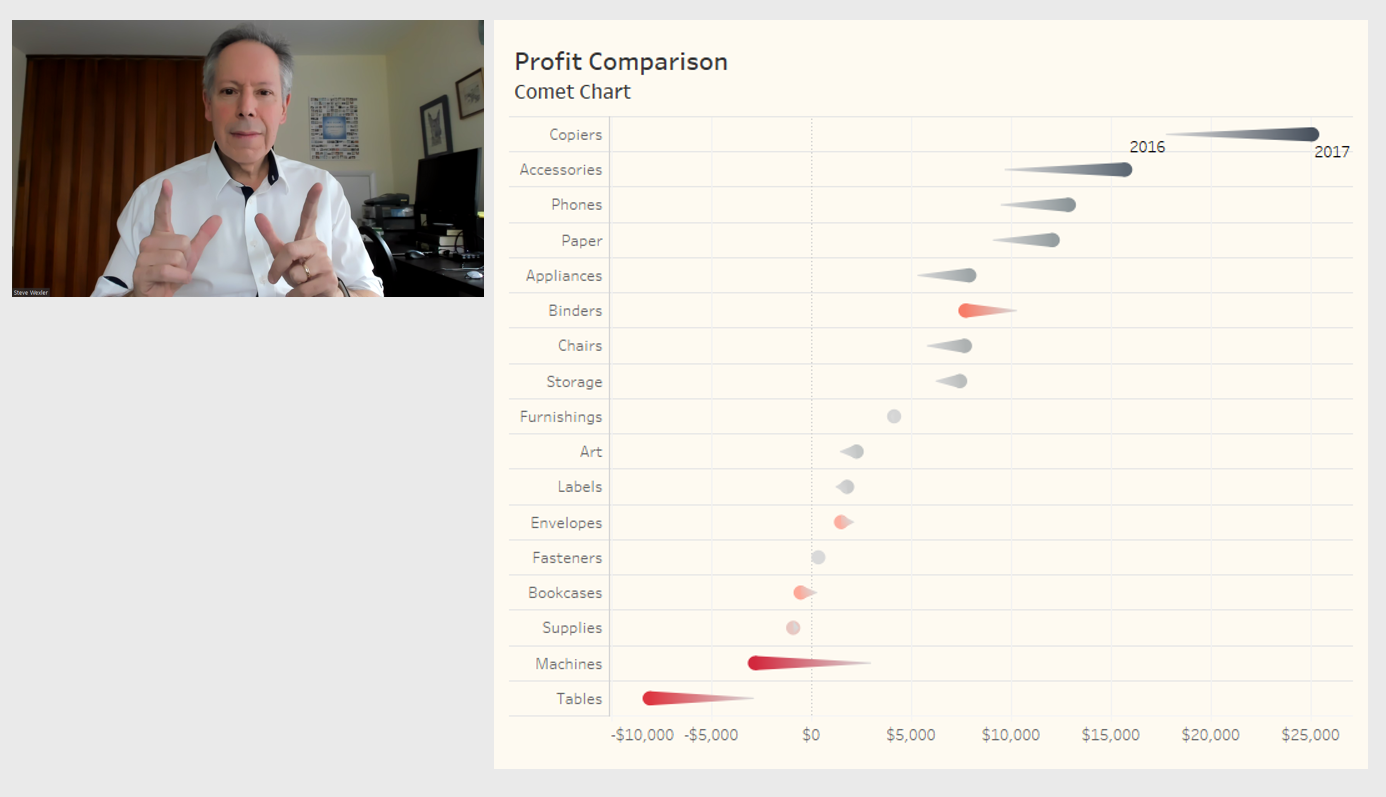
Steve will show some of his favorite Tableau tips and tricks as well as answer questions about anything you want to know (e.g., dashboard design, Storytelling, IronViz, Salesforce acquisition, Motown basslines, etc.)
Overview I've conducted a lot of Tableau training classes and have found three things that confuse students simply because of the nomenclature Tableau uses for these things. These three terms are Headers Table Calculations Quick Filters Headers Consider the chart below that has both mark labels and an axis along the bottom. Figure 1 [...]
[gview file="https://datarevelations.com/wp-content/uploads/2015/07/DataRevelations_Vol1Number32.pdf" height="1900px" width="700px" save="1"]
[gview file="https://datarevelations.com/wp-content/uploads/2015/05/DR_Newsletter_1_11.pdf" height="2750px" width="700px" save="1"]

