Search results for: jitter

Need a new search

If you didn't find what you were looking for, try a new search!

Is this better than a Jitterplot? Could be

By |2020-02-16T23:25:08+00:00July 22nd, 2018|Business Visualizations, General Discussions, Visualizing Survey Data|

July 22, 2018 Overview After writing my blog post about why I still love the Jitterplot, I got some thoughtful feedback from Adam McCann, Jeffrey Shaffer, and the always provocative Daniel Zvinca. Dan had written a wonderful article suggesting a Stingray plot as an alternative, and Jeff and Adam’s comments encouraged me to revisit [...]

Boxes, Whiskers, and Jitters

By |2014-01-16T14:27:43+00:00January 16th, 2014|Business Visualizations, General Discussions, Makeovers|

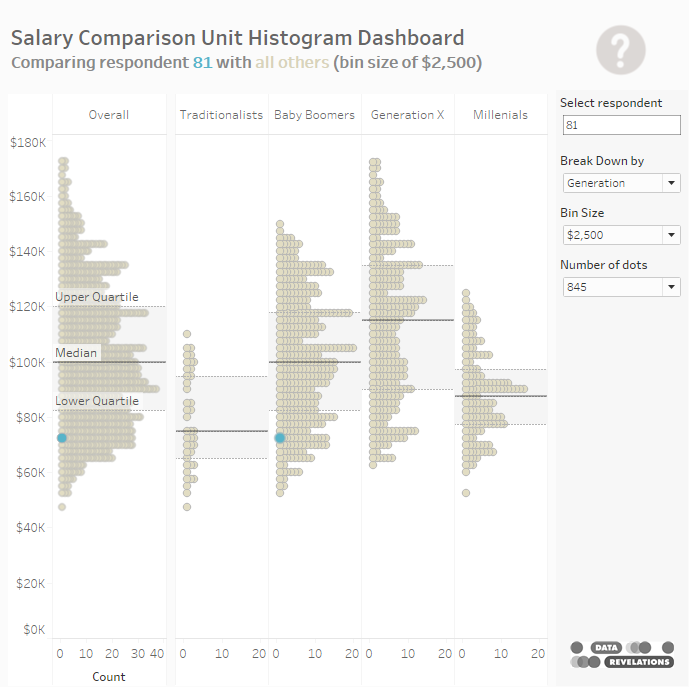
Overview One of the new features in Tableau 8.1 that Tableau Software is trumpeting quite a bit is one-click Box and Whisker Plot generation.  While I appreciate the new functionality, this chart type doesn’t “sing” to me the as much as jittering does.  Indeed, this “jittering” capability was the BIG discovery for me in 2013. [...]

Visualizing Survey

By |2023-08-01T23:12:54+00:00October 4th, 2021|

Visualizing Survey Data Using Tableau On-Demand Course $299 for one year of access Enroll Now Interested in enrolling a group of people? Click Here Overview I've been using Tableau to visualize survey data for more than 15 years and I've trained thousands [...]

Comments Off on Visualizing Survey

Visualizing Survey Data

By |2023-09-15T01:06:32+00:00January 10th, 2020|

Whitepapers & Presentations  / General Survey Considerations  /  Likert Scale & Divergent Stacked Bar Visualizations  /  Benchmarking & Visual Ranking   /  Makeovers View by: Whitepapers & Presentations  General  Considerations  Makeovers Likert Scale & Divergent Stacked Bar Visualizations  Benchmarking & Visual Ranking   New! On-Demand Course [...]

Comments Off on Visualizing Survey Data

Chart Chat Live – Round 1

By |2022-03-23T20:40:46+00:00November 28th, 2018|Business Visualizations, Chart Chat, Videos|

November 28, 2018 Thank you to everyone that joined our first Chart Chat Live webinar. https://youtu.be/Z3wLmRvy4YQ In addition to the recording above, you can also download Steve’s slides here and download Jeff’s slides here. Recap After brief introductions, Steve discussed color and the use of BANs. Steve discussed “Lonely [...]

Marginal Histograms — They’re Not Just for Scatterplots

By |2017-04-25T13:21:35+00:00April 25th, 2017|Business Visualizations, General Discussions|

April 25, 2017 Overview I became a big fan of adding a marginal histogram to scatterplots when I first saw them applied in Tableau visualizations from Shine Pulikathara and Ben Jones. For those not familiar with how these work, consider the scatterplot shown in Figure 1 that shows the relationship between salary and age. [...]

Dr. Strangechart

By |2017-03-20T07:49:10+00:00March 20th, 2017|Business Visualizations, General Discussions, Makeovers|

Or How I stopped worrying and learned to love appreciate the Marimekko March 19, 2017 Overview Readers of my blog know that I suffer from what Maarten Lambrechts calls xenographphobia, the fear of unusual graphics.  I’ll encounter a chart type that I’ve not seen before, purse my lips, and think (smugly) that there is undoubtedly [...]

When filtering produces too few survey responses

By |2016-10-17T14:15:46+00:00October 17th, 2016|General Discussions, Visualizing Survey Data|

Overview So, you’ve created a wonderful collection of survey data dashboards that have innumerable demographic filters so that users can, for example, just see responses from left-handed Los Angeles Lakers fans between the ages of 34 and 39. So, what’s the problem? Actually, there are two problems. The first occurs when extreme filtering reduces the [...]

Title