Chart Chat Live — Round 9
Amanda Makulec joins Steve and Jeff and they discuss The Data Visualization Society Mona Chalabi and Marimekko charts Grammar of graphics and comparing Tableau with Power BI Curved timelines https://youtu.be/fSyMMrVkDEM

Amanda Makulec joins Steve and Jeff and they discuss The Data Visualization Society Mona Chalabi and Marimekko charts Grammar of graphics and comparing Tableau with Power BI Curved timelines https://youtu.be/fSyMMrVkDEM
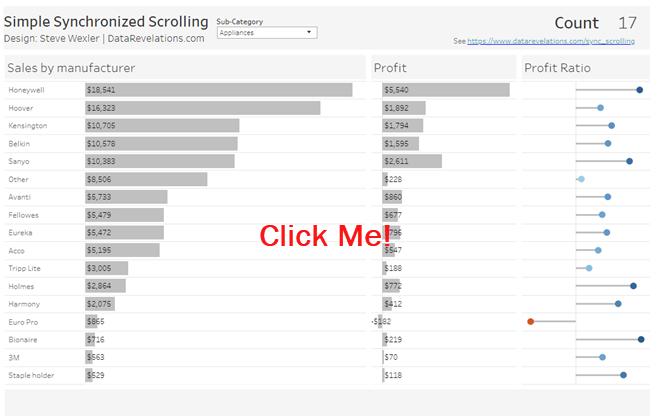
January 14, 2020 Overview Going back to 2013 I’ve had a “wish list” that Tableau has either addressed (navigation buttons, collapsible / expandable containers) or is about to address (dynamic parameters and server-side animation). One feature request that still remains unmet is being able to change the width of individual columns on a [...]

December 31, 2019 So many tools, technologies, and initiatives Are you trying to learn and / or keep up with any of these tools, technologies, initiatives, and features? TableauPowerBIQlikMicrostrategyLooker, FlourishD3AlteryxTableau PrepTableau ServerKnimeRSPSSMapboxPythonAIMachine LearningSQL ServerPostgresJSONData Visualization SocietyMakeover MondayWorkout WednesdaySWD ChallengeIronQuestIronVizSports Viz Sundayset actionsviz animationsparameter actionsdynamic parametersspatial functionsetc. Just keeping up with one of these can [...]
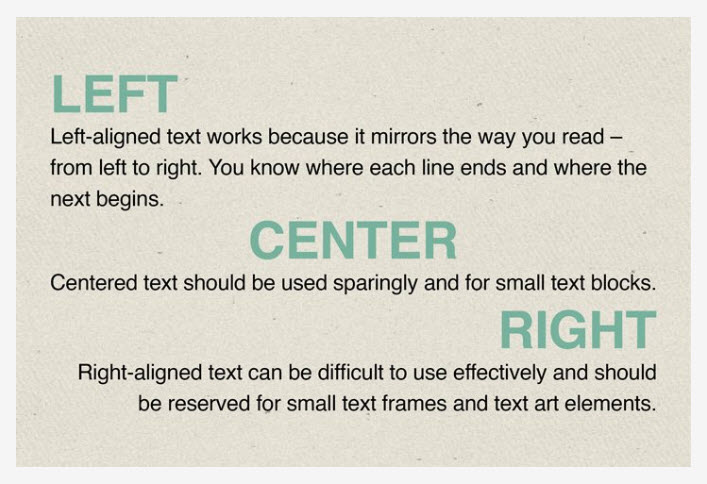
Or at least have a very good reason for doing so. Note: My observations are for dashboards in languages where one reads from left to right. If you create dashboards in Aramaic, Arabic, Hebrew, Urdu, etc., just reverse everything. IMPORTANT: Since posting I've received lots of feedback on this. I want to [...]
Steve and Jeff discuss Animation and transitions Iron Viz 2019 https://youtu.be/9tkBl8k8BUU
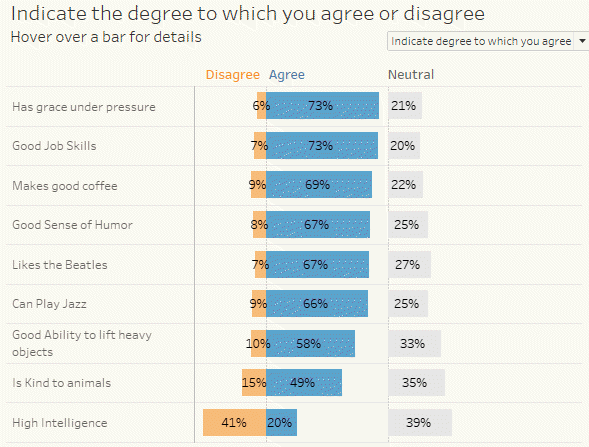
November 3, 2019 Overview Anyone that follows this blog or visits datarevelations.com to read articles on visualizing survey data know that I spend a lot of time thinking about how to present Likert scale data and what to do with neutral responses. I remain a stalwart supporter of some type of divergent stacked bar [...]
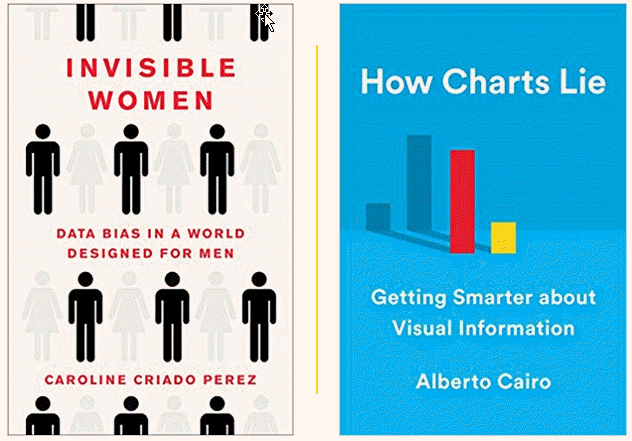
October 23, 2019 I’ve read some great books this year. Here are two that I think are noteworthy. Invisible Women: Data Bias in a World Designed for Men By Caroline Criado Perez My father was an ardent feminist. This was very rare for someone of his generation and I thought how lucky I was that [...]

October 21, 2019 Kelly Martin A friend and colleague died a few weeks ago. Her name was Kelly Martin and she had a profound impact on me and the entire Tableau community. There is much I could write about her, but I know I will not do as good a job as Bridget [...]
Steve and Jeff discuss Kelly Martin How Steve spent his summer (a lot of reading) The importance of iterating Data Visualization Society survey Tableau animation (alpha release) https://youtu.be/C5TEXhqjx-E
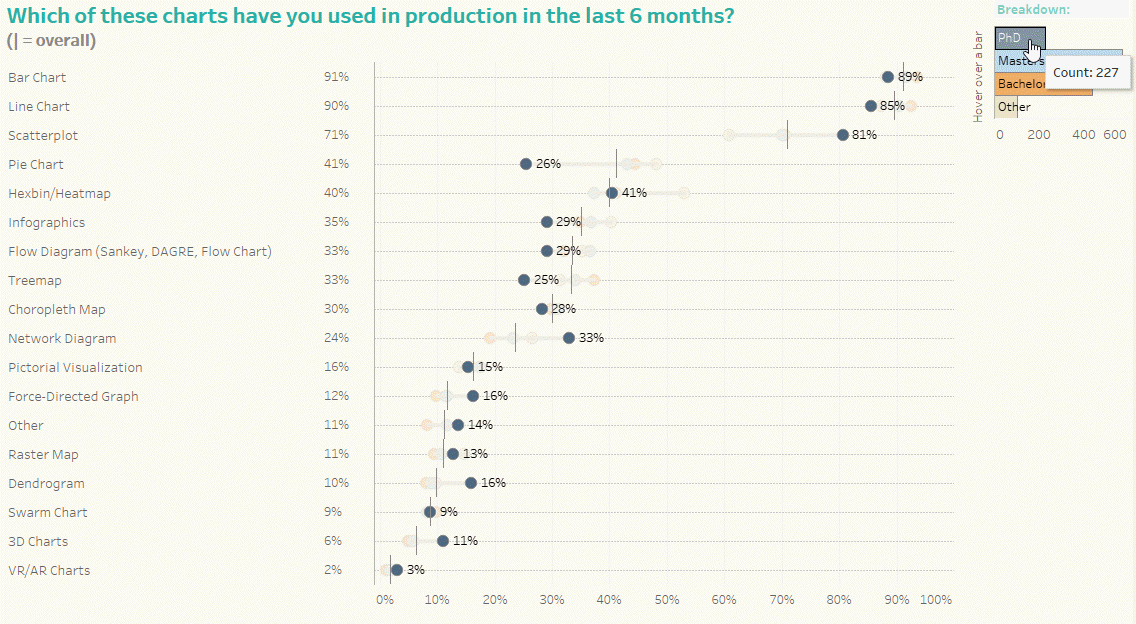
September 29, 2019 Overview 1,359 people participated in the 2019 The Annual Data Visualization Community Survey conducted by The Data Visualization Society (DVS). The survey covers professional data visualization details like salary and hourly compensation, tool use, location, demographic data, audiences, organizational structure, and more. I think this is an ambitious, bordering on heroic, [...]

