
Overview
In an October 2015 meeting of the Tableau Zen Masters each Zen Master was asked to name his / her favorite thing about Tableau. Most people started by saying “well, besides the community, my favorite thing is…”
At the time I said “undo”. Don’t laugh. Let’s not take it for granted that with Tableau we can try things, fail, and go back to where we were before we failed… gracefully.
After the meeting I thought more about this question and how there are unheralded aspects of the tool and the ecosystem that I count on but that don’t get the attention they deserve. I realized that there is one thing in particular that I use almost every day and without it I, and scores of others, would be at a major loss.
Tableau Public.
What is Tableau Public
Tableau Public consists of a free downloadable version of Tableau desktop to explore and visualize data, and a free cloud platform to host, share and embed interactive visualizations.
While I use my regular copy of Tableau desktop to explore data and fashion visualizations, it’s the free hosted version of Tableau Server (the cloud platform) that allows me to do so much and to learn so much.
Sharing
My website consists mostly of examples and blog posts and most of those posts contain Tableau dashboards that are embedded right inside the post. I don’t have to ask people to download a reader and then download my dashboards. The dashboards are right there.
Learning
But it gets better. Anyone with a copy of Tableau who is curious about how the viz works can just download the workbook, open it up, and see how it’s put together.
For example, a couple of years ago I wanted to see if anyone had recreated Hans Rosling’s famous Gap Minder demo in Tableau. A quick Google search lead me to this example from Jeffrey Shaffer.
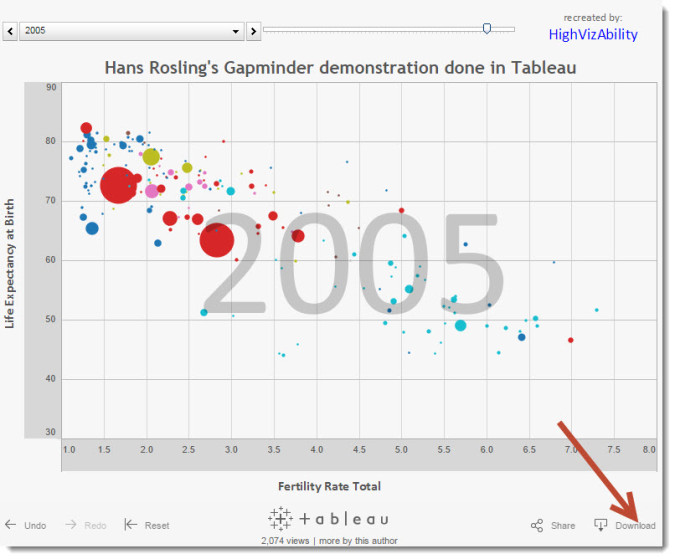
Figure 1 — Jeffrey Shaffer recreates Rosling’s Gap Minder. Click here.
I was curious to see how Jeff had gotten the year to display as big block letters in the middle of the viz, so I downloaded the workbook and “looked under the hood.”
Over the years I’ve downloaded hundreds of workbooks and have analyzed the individual brush strokes of Kelly Martin, Andy Cotgreave, Ben Jones, Anya A’Hearn, and dozens of others. That I can do this so easily is nothing short of amazing. I don’t just get to interact with cool vizzes; I can download them and see how they work.
Adding to the conversation
Because the vast majority of Tableau Public authors do make their work downloadable, you’ll see people modify and repost the work they’ve downloaded. Andy Cotgreave wrote about this in late 2014 where one way of visualizing something begat other ways of visualizing the same data. Here’s a particularly beautiful example from Michal Mixon.

Figure 2 — A stunning dashboard from Michael Mixon that you can download from here.
It Isn’t Perfect
Before you accuse me of writing a hagiography, there are several shortcomings with Tableau Public.
Row limit
You can only have 100,000 rows. No, now you can only have 1,000,000 rows. Okay, as of May of 2015 you can have 10 million rows of data. Not really a shortcoming.
Locking down your data
Your workbooks and the underlying data can be downloaded and examined. As of May of 2015 you can “lock down” your workbooks and your data. This is huge as it allows public-serving organizations with proprietary data to publish interactive workbooks without fear that somebody will download and examine the underlying data.
That said…
Unless you indeed have proprietary data please, please, please don’t stop your workbooks from being downloaded.

Figure 3 — This setting is on by default. Please don’t turn it off unless you have a good reason (e.g., the underlying data is proprietary).
Tableau and the community that supports it are giving you this amazing free platform for you to showcase your work. Please allow others to benefit by making your work downloadable.
Just because something is anointed a Tableau Public “Viz of the Day” does not mean it is a good viz
Many Viz of the Day selections are examples you should emulate, but I’ve seen some really bad vizzes that made the cut because the subject matter was “discussion-worthy”. The problem is that those who are new to data visualization won’t know that these vizzes aren’t worth emulating. They’ll just think “hmm, that viz with the word cloud and donut charts was a ‘viz of the day.’ I guess it’s a good thing to make vizzes with word clouds and donut charts.”
As Tableau comes out with new versions they tinker and break things
I understand that Tableau Public is an evolving platform and that Tableau wants to improve that platform by adding new features. The problem is that I’ve had many dashboards that suddenly stops working. Tableau has been great at responding to notices that things are broken, but sometimes it can take hours, if not days, to fix. So…
Favor: Please add my website to your test suite. In other works, do not implement any new features until you’re sure everything on my site works perfectly.
Okay, okay, okay… but it doesn’t hurt to ask.
Things I cannot do without
Here’s a summary of the things I cannot do without in my practice.
I would not be able to do what I do without Tableau Desktop.
I would not be able to do what I do without the community that supports Tableau.
And I would not be able to do what I do without Tableau Public.
My sincere thanks to the Tableau Public team.


