
Should you use dashboards to tell stories or to find stories?
You can’t tell a good story if you don’t understand the data, and a good dashboard will help you understand the data, faster.
My thanks to Adam McCann, Athan Mavrantonis, Andy Cotgreave, and Jeffrey Shaffer for reviewing and providing feedback.
Why do we need dashboards?
Shortly before The Big Book of Dashboards was published, I had the good fortune to attend Cole Nussbaumer Knaflic’s Storytelling with Data workshop. Great content, great presentation, and I got… worried. I remember thinking “this is really good… why will anybody need the dashboard book?”
It was shortly after this momentary panic that Cole described a tendency that many people have in presenting their data. They want to relate just how long and hard they worked. “Look at all these data sources! Look at all the rows… look at all the columns! Look at every stone I unturned!”
Cole then related a wonderful metaphor:
“You have to shuck a lot of oysters to find a pearl. When presenting, don’t show all the oysters you shucked, just show the pearl.”
With these words I became calm as I realized what is so useful about dashboards.
Dashboards can be like automated oyster shuckers; that is, you can use them to find the best stories in your data and to find those stories—fast.
What you then do with those pearls… well that’s where the storytelling part comes in. Yes, you can tell stories in a dashboard (I’ve seen some amazing things) but I don’t think that’s the best use for them. Indeed, I think it’s fine for dashboards to be… boring.
Let me make my case.
Note: Are these “pearls” in fact stories, or just great insights from which you can craft a story? And just what is a “data story” ? I’ll address this towards the end of the article.
So, just what is a dashboard, anyway?
Those that follow my work or the work of my fellow book authors, Andy Cotgreave and Jeff Shaffer, know that the three of us agonized over the definition of a dashboard. After months we agreed on this intentionally open-ended definition:
A dashboard is a visual display of data used to monitor conditions and/or facilitate understanding.
Note we didn’t get into explanatory vs. exploratory, interactive vs. static, fits on one screen vs. scrolls vs. drills down to another screen, etc.
I know that Stephen Few took exception to our writing “and/or” (versus just “and”) and that Nick Desbarats might argue that our imprecise definition may be contributing to mismanaged expectations. I’ll come back to some of Desbarats’ concerns at the end of this post, but for the time being let’s just run with our definition and I’ll walk you through two examples where we see how a simple dashboard will facilitate understanding which in turn can lead to superior data visualizations and storytelling.
Example One – If the world were 100 people
This first example comes from Makeover Monday exercise from 2017. Here’s a snippet of the data
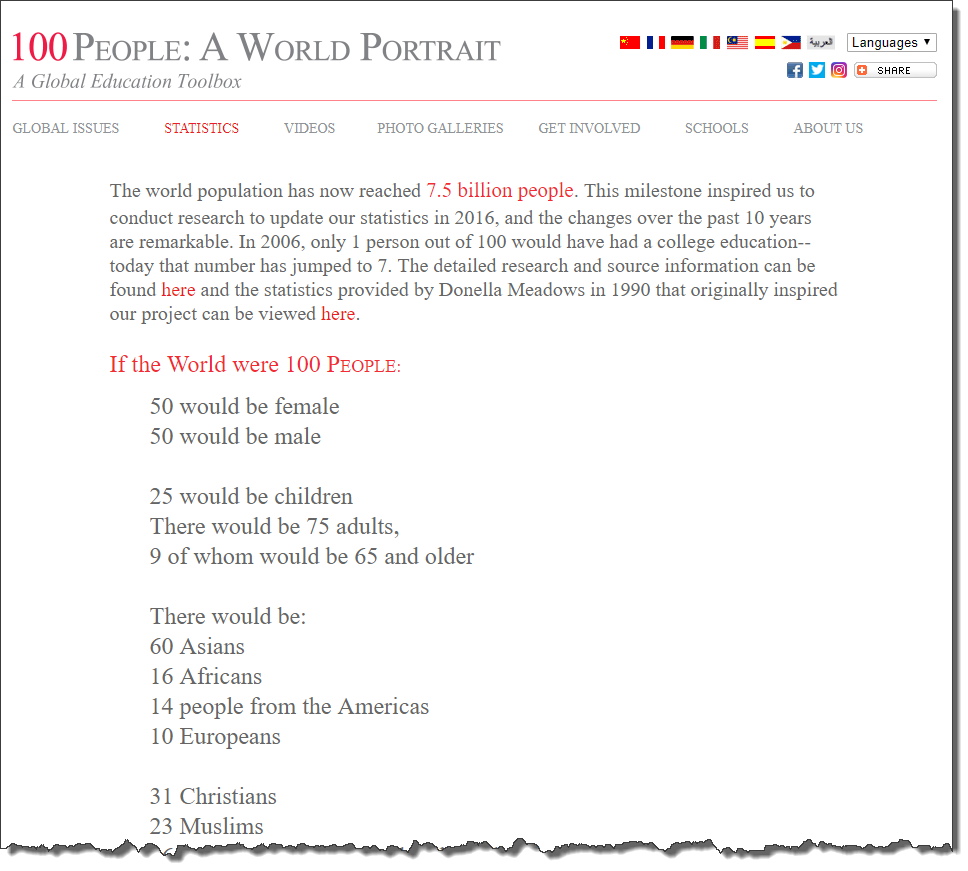
Figure 1 – see https://www.100people.org/statistics_100stats.php?section=statistics
And here was the visualization that people were tasked with making over.
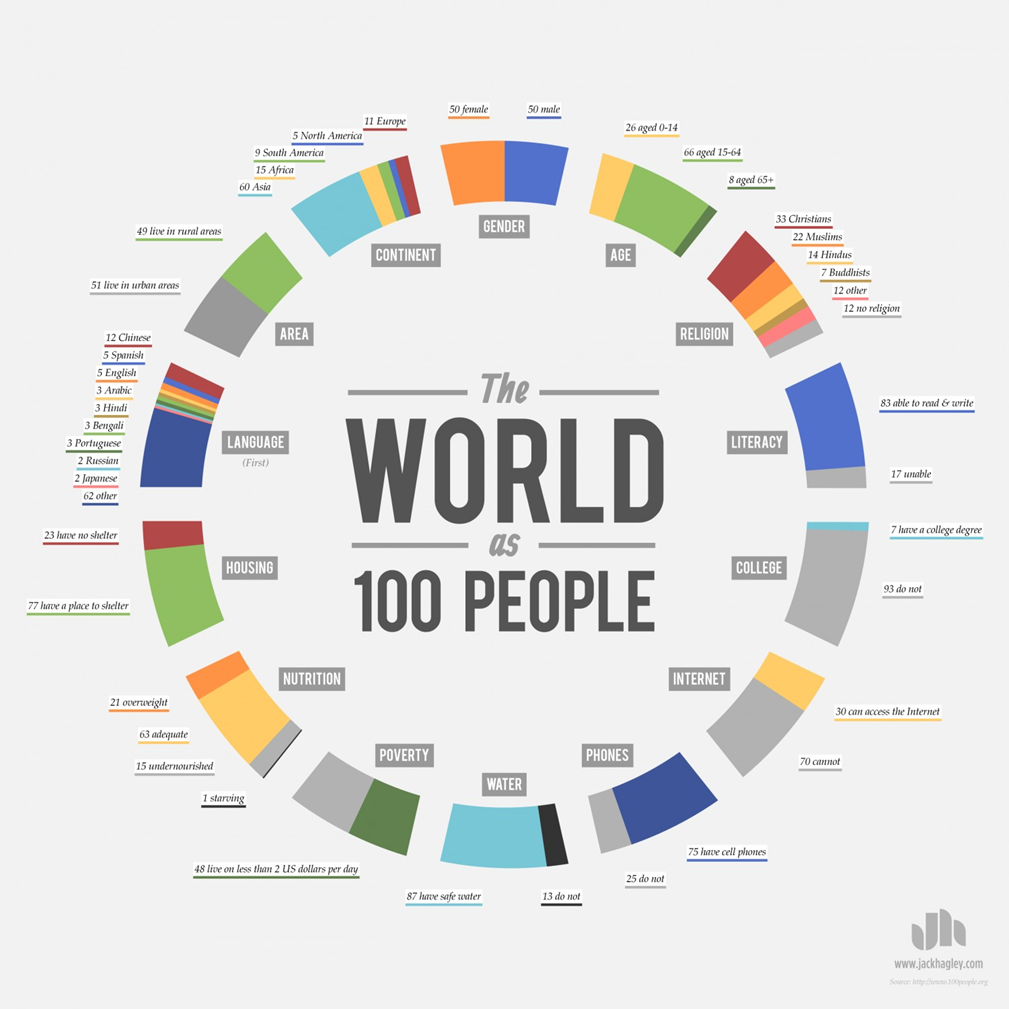
Figure 2 – see https://visual.ly/community/infographic/geography/world-100-people
I wanted to get a solid handle on this data, so here’s the visualization I built.
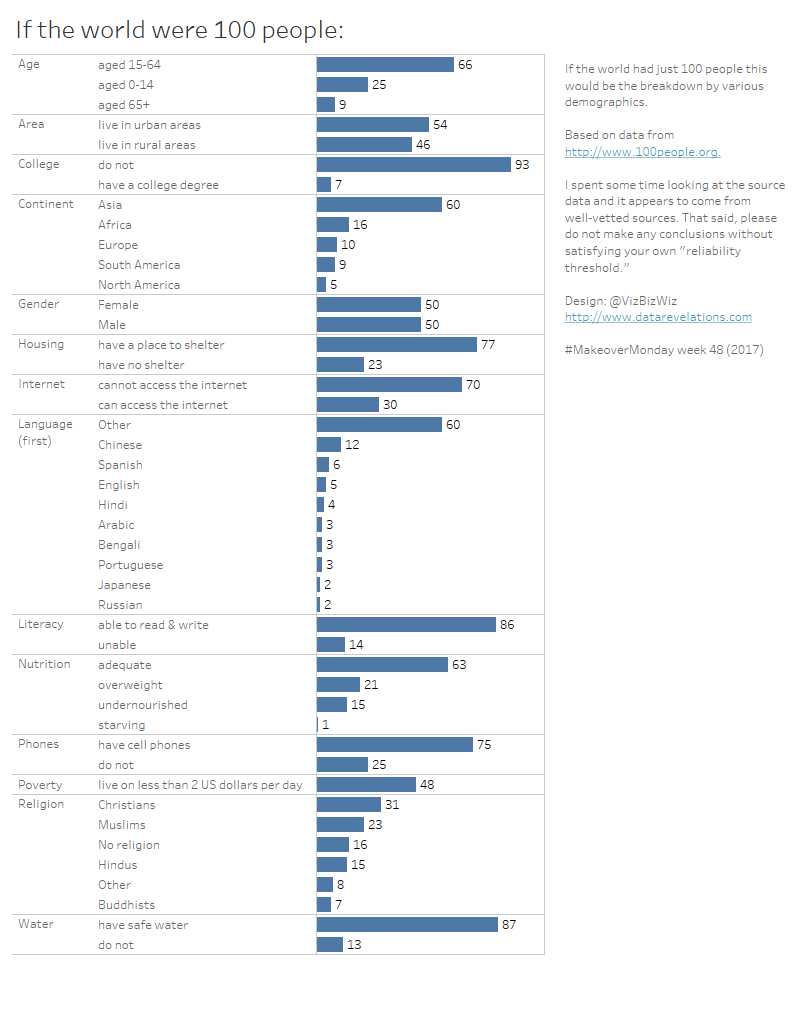
Figure 3 – My rather uninspiring Makeover Monday submission.
I would never publish this. Okay, I *did* publish this, but would not expect anybody to act or be moved by anything I built. I made the dashboard simply to help me understand the data.
So, what might I do with it, now that I have a handle on it? What facet might I want to highlight and what story might I want to tell?
Maybe I want to focus on nutrition.
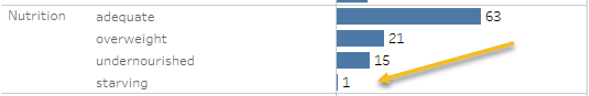
Figure 4 – Focusing on the 1 out of 100.
What does it mean that 1 out of 100 people is starving?
Here’s what Athan Mavrantonis did with this data.
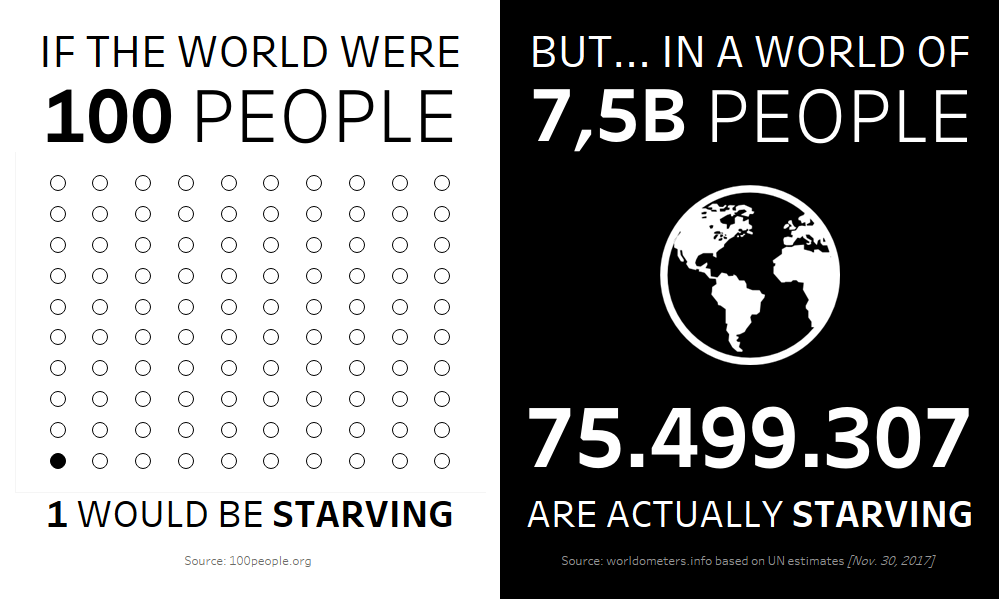
Figure 5 – Athan Mavrantonis’ stark, and stunning, visualization.
This is a simple and elegant visualization, but also very powerful. Indeed, you don’t need to create something complex to have an impact.
This visualization is also beyond my design abilities. But, had I wanted to create something like this for a magazine I might have hired somebody with Mavrantonis’ skills—but only after I first had a solid understanding of the data.
Note that I have no idea if Mavrantonis started first with a simple bar chart, considered the facets of the data set, and then created this powerful image. But whether that was the case or not, I do know the following to be true:
You can’t tell a good story about the data if you don’t have a clear understanding of the data.
Example Two – Visualizing Eli Manning’s Career
I am a big fan of Adam McCann’s work and how he shares his expertise. I think of him as the Wynton Marsalis of data visualization as he is uncommonly adept with both straightforward business visualizations (“classical music”) and more experimental forays (“jazz”).
He recently published this interactive data visualization about New York Giant’s quarterback Eli Manning’s career.
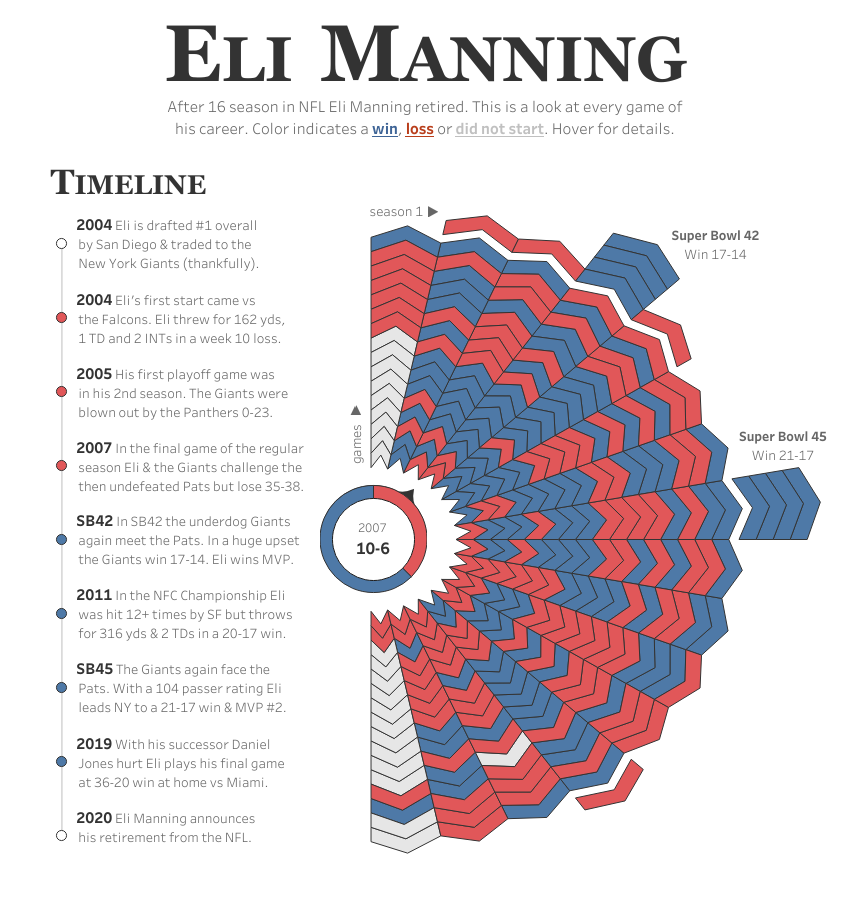
Figure 6 – Adam McCann’s creative and engaging interactive dashboard.
Any time I see a graphic (let alone a novel and creative one like this) I go through the same thought process:
- What is this telling me?
- Why did this person choose this way to display the data?
- How did this person build this?
- Is this how I would have visualized the data?
Ut, oh… beware of those last two points as you’ll end up going down the rabbit hole (as I did).
Note that Adam’s dashboard was downloadable, so I could see how he built it and leverage whatever work he had done to create my own take on the data. Indeed, Adam had done a lot of the “oyster shucking” already with respect to setting up the data, preparing calculations, establishing a color palette, and so on.
Here’s what I came up with.
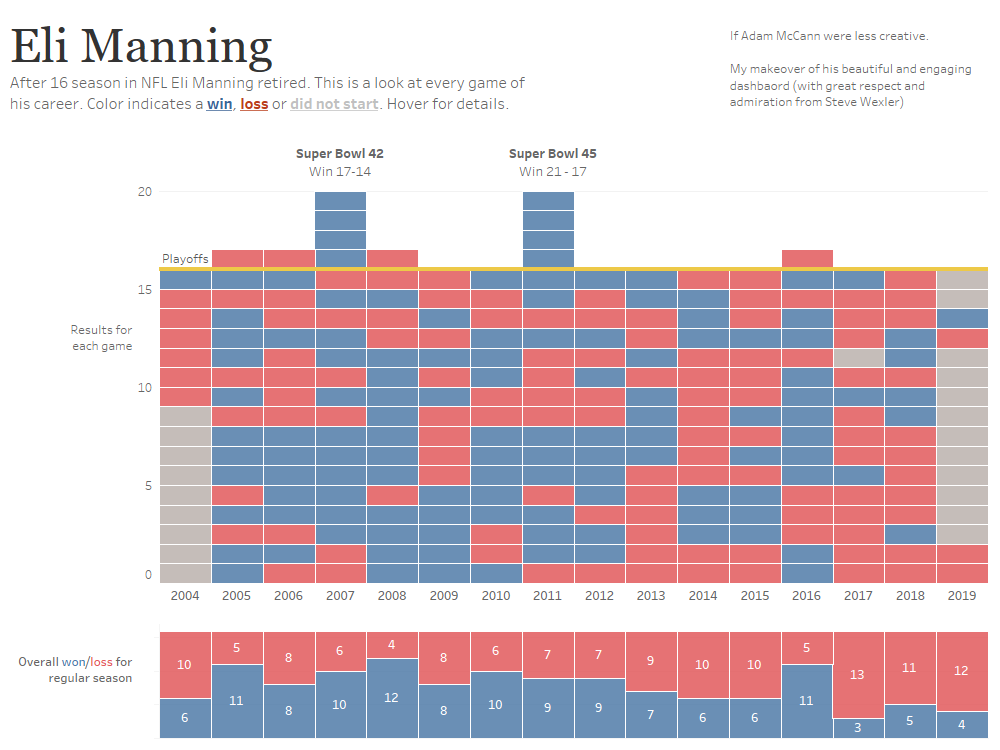
Figure 7 – My makeover of Adam McCann’s dashboards.
This is not visually arresting, and some might consider it boring.
But wait! There’s an amazing “pearl” in the data and it’s right there! Can’t you see it?
Well, of course you can’t.
How about now?
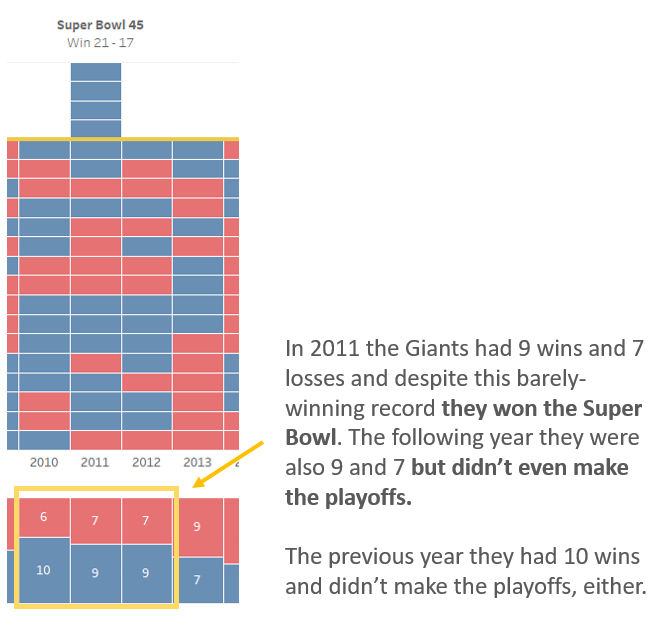
Figure 8 – The story I found, highlighted and annotated.
This finding makes the 2011 Super Bowl win even more impressive to me, and because I had a simple dashboard, I was able to find this pearl quickly.
So, now that I have a pearl, what should I do with it? This is where the storytelling part comes in as I might want to explore how the Giants managed to sneak into the playoffs and despite their underdog status won the three playoff games and then the Super Bowl.
You should ask yourself the same question of what you find in your data.
What you do with the curated results (the pearl) is up to you. Maybe you use Storypoints in Tableau, or some form of scrollytelling, or craft a tight presentation in PowerPoint (or, heaven forbid, create a longform dashboard) but realize that you can’t do anything until you have a solid understanding of the data.
And for me, *that’s* the best reason to use dashboards.
Postscript: I encourage you to watch Nick Desbarats’ presentation The 13 Types of Displays That Are All (Unfortunately) Called “Dashboards.”
In this presentation, Desbarats asserts that
- Most dashboards fail (I agree with this.)
- We need to have a clear taxonomy of dashboard types so we can manage audience expectations (I disagree with most of this, but you should still watch.)
- There’s a right way and wrong way to garner buy-in from your stakeholders (this comes around 70% into the presentation and is absolute gold.)
Just What is a Story, Anyway?
One of my book co-authors, Jeffrey Shaffer, asked me to read this article from Tableau Iron Viz champion Josh Smith. I now realize that how I use the word “story” and others use it may be wildly different. Smith points out that telling a story involved characters, a plot, a narrative, tension, release and so on. In my case I was equating “where’s the good story in the data?” with “what in the data is worth turning into a story?” These are two different things so I will clarify and say I think a dashboard is a great place to find what in the data is worth elevating into a story.
As for how you tell that story? I can recommend the following resources:
Storytelling with Data by Cole Nussbaumer Knaflic
Presentation Zen by Garr Reynolds
Slideology by Nancy Duarte
Postscript
I asked Athan Mavrantonis to review this post and share his thoughts on building his “If the world were 100 people” visualization. Here’s what he had to say:
I had not done any exploration before designing it. I created the initial visualization very quickly in Illustrator and only replicated it in Tableau later that day, upon Rodrigo Calloni’s request.
I was familiar with the dataset prior to MakeoverMonday. Bill Gates had used this data before and tweeted a stacked area chart showing the trends for each dimension over time from the 1970s to 2017. His point was very optimistic as the percentages of the people who were undernourished or starving were dropping significantly over that period. When I saw this viz, I remembered thinking his way of representing the data wasn’t fair because it ignored the exponential growth in the world’s population over the same period.
So, when I came across “The world as 100 people” dataset in that MakeoverMonday even as a point in time, I knew immediately what I wanted to visualize. I wanted to offer a different angle comparing the relative to the absolute numbers side by side. I chose to visualize only the number of people starving specifically because it was only 1 out of 100. I felt this chart would help the audience resonate with the one black circle in the context of it representing a unique, starving, human being. On the other side I presented a BAN to emphasize how many people were hidden behind that single dot.
I think my design and layout decisions are clear. Tried to keep it as simple and direct as possible, I didn’t use any color, and I focused on contrast between the two different perspectives.


