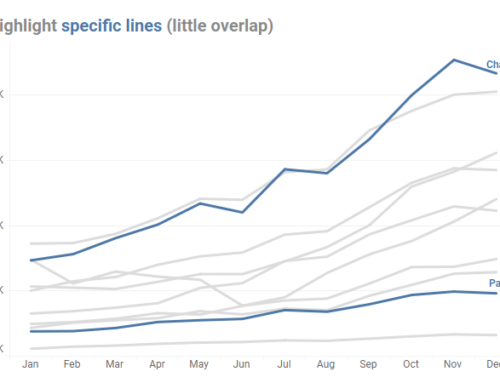
In this Chart Chat we’ll look at the Index Chart popularized by the Financial Times and how and why you should use it in your own organizations, how the New York Times reported record unemployment claims (Jeff liked it, Steve hated it), issues around data humanism, some of the best work we’ve seen over the past few weeks (including a new chart type that warrants a discussion), and of course, a few Screaming Cats.
By Steve Wexler|2020-04-18T17:06:53+00:00April 18th, 2020|Business Visualizations, Chart Chat, Videos|0 Comments


