Benevolent Manipulation in Data Visualization
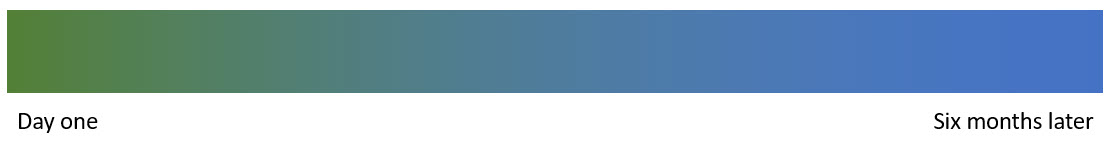
July 15, 2019 Overview In the workshops I present attendees learn from each other as well as from me. Here are two oh-so-brilliant ideas that came from attendees. How to get your organization away from using green and red As Kelly Martin has written, in addition to red and green being so hard to [...]