Note: This post is dated but contains useful information. I’ve discovered some better ways to handle this but haven’t blogged about it yet. Feel free to nag me and I’ll either write the post or conduct a screen-sharing session.
Overview
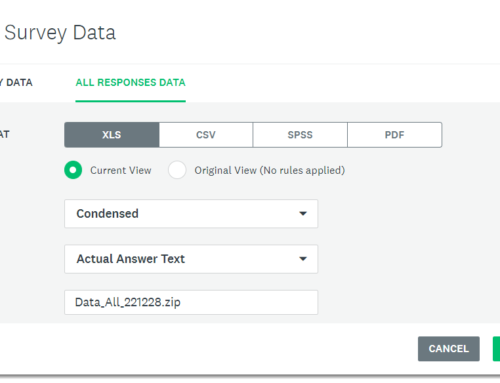
Note: If you have not already done so, please review Part 1, Part 2, and Part 2 ½ of this series. You can also download the source data from here. The completed interactive dashboards can be found at the bottom of this post.
I continue to get questions about how to handle survey-related issues in Tableau. The latest inquiry comes from Tony in the UK where Tony asks how to address respondents that are members of multiple organizations / categories. Here’s an example of the type of “demographic” question that Tony has in mind:
In what countries does your organization maintain operations (check all that apply):
[ ] USA
[ ] Canada
[ ] Japan
[ ] Liechtenstein
etc.
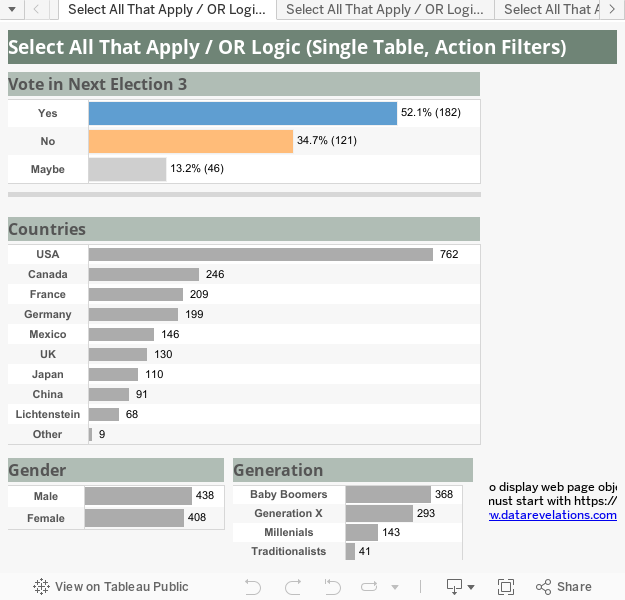
Our goal is to have a dashboard that either looks like this:

Dashboard using action filters
or like this:

Dashboard using quick filters
Here’s how the country data might be encoded by the survey tool where 1 indicates yes and 0 indicates no.

First Approach — One Table
Depending on your willingness to use visual filters (actions) you can treat these Country fields like all other “Question” fields and reshape the data so that it looks like this:

You can now create a visualization that looks like this one:

There are a number of funky things going on here to make this work properly. Let’s first look at what is on the filter shelf where we are filtering by Question and Value.
The Question filter is set to show just the so-called “Country” questions, as shown here.

Note that UK and USA are at the bottom of the list. Also note that for the main visualization in the dashboard (the one that shows “Will you vote in the next selection”) the Question filter is set differently.
We also need to set the Response values to 1 so that we get a proper tally for each country as the survey was set up so that 1 = yes and 0 = no.
Level of Detail
You’ll notice that we have ID on the level of detail. This is because for the main visualization (the one where we ask the question “Will You Vote In The Next Election”) the Question filter is set differently. We need this level of detail for our action filter so that we can pass the IDs of folks that are in a particular country to the other visualizations on our dashboard. Note that normally when you add this level of detail you would see a separate bar for every ID. We get around this by turning Stack Marks off from the Analysis menu.
We also need to use a table calculation (we’ll call itCheckAll_Count) to sum up all the responses across ID:
TOTAL(SUM(Response))
Does This Work?
If you select the country name (so that all marks are selected) the visual filtering will work fine.

If, however, you select the bar itself you run into problems as you end up passing only one ID the other visualizations.

So, is it okay to go into production with this? That is the reader’s call, but I can pretty much guarantee that if you show this your CEO he / she will click the bar and not the label, so…
Second Approach — Two Tables
The advantage of the next approach where we join two tables is that you won’t run into the possible user experience issues cited above and you will be able to use quick filters. The only downside is that we end up with many more rows of data (but Tableau can handle it like a champ…Tableau Public, on the other hand, balked at allowing me to upload a workbook with more than 100K rows).
In this example I’ve created a second table that just contains the “Country” questions, reshaped.

We then craft the following join in Tableau.

Note that we could also have joined the main table (Reshaped) to itself to achieve similar results.
We now have Country data reshaped and separate from Question data, and we can filter by Country.

We can also craft a visualization using action filters without fear that somebody will select a bar rather than the entire category.
Summary and What’s Next
We now have a way to handle “OR” logic pretty easily and can handle queries like “show responses from people with operations in China, or Japan, or France”.
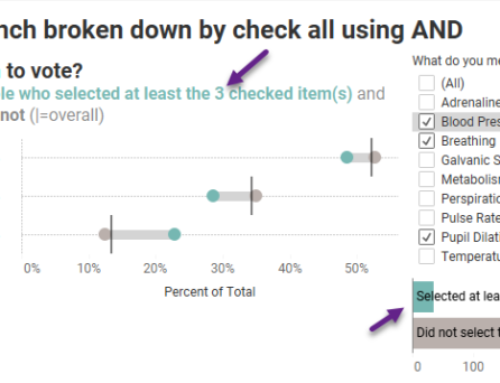
But what about “AND” logic where we only want to see responses from people with operations in China AND Japan AND France?
If there’s enough interest I’ll write another post.