
I’ve received a lot of requests to address the unique (and annoying) issues with getting SurveyMonkey data to play nicely with Tableau. The good news is that once you know where the stumbling blocks are it’s not very difficult to get your data “just so” so that you can create clear visualizations that provide solid insights.
Speaking of getting the data “just so”, if you are not sure what I’m talking about, make sure to either read the Tableau whitepaper or read this blog post.
The main issues with SurveyMonkey data
There are two “gotchas” with SurveyMonkey data:
- You need to reduce the two column headings into one.
- You need to fix how check-all-that-apply questions are coded.
Want to follow along? You can download all the source data here.
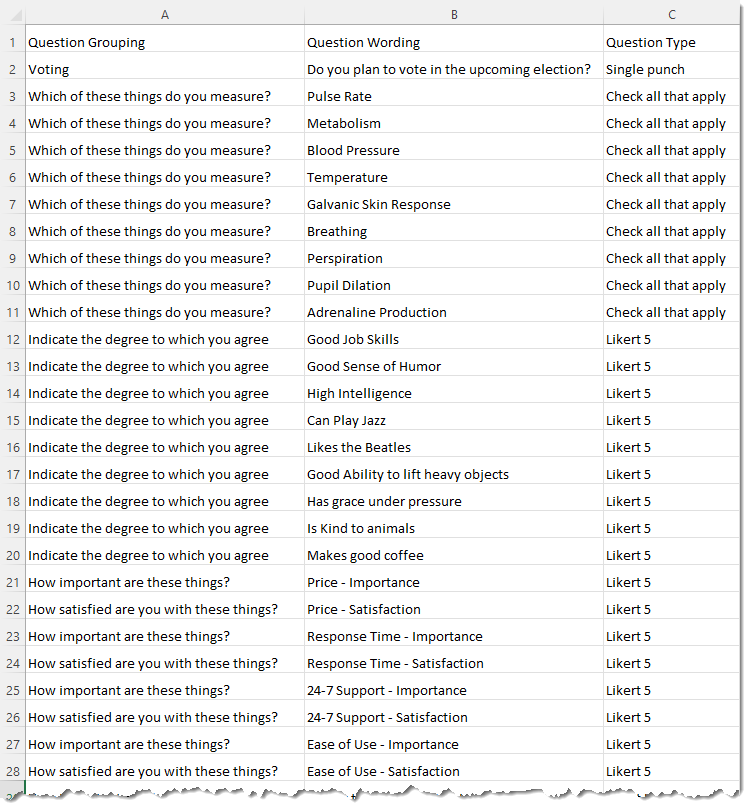
What the data looks like
Before we even get into the data, let’s see what the survey looks like “out in the wild.” Have a look at https://www.surveymonkey.com/r/6PW6XZZ, and in particular, look at this check-all-that apply question.
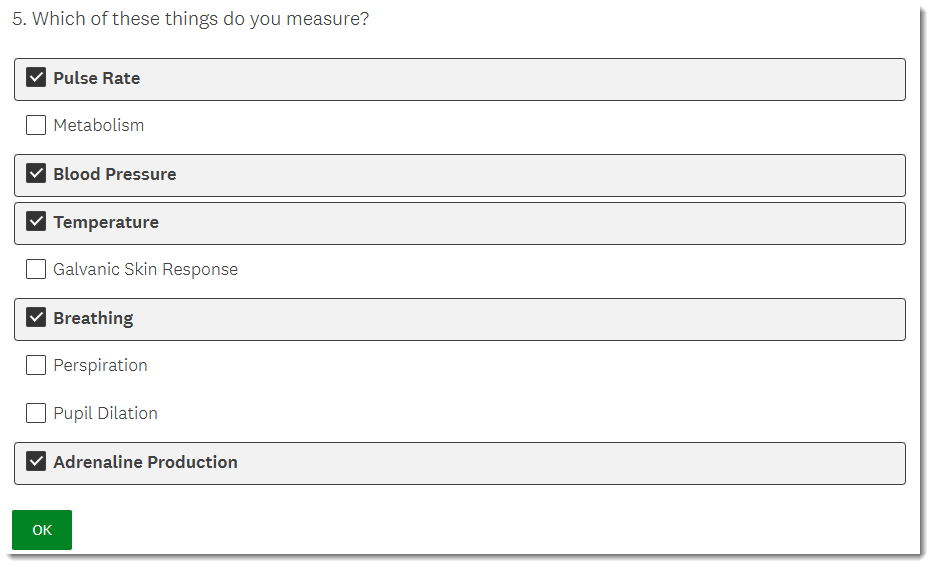
Let’s look at how this question (and all the other questions) are encoded when we download the data in either an Excel or CSV format.
If you are using either EasyMorph or Alteryx you can download the data as an SPSS file. Both tools handle SPSS files well in that they recognize both the numeric and text formats of the data. As of this writing, Tableau Prep does not handle this well so we’ll need to download in Excel or CSV format.
As for SurveyMonkey’s Tableau web connector, it’s good! It even codes check-all-that-apply questions in a very Tableau-friendly way.
But…
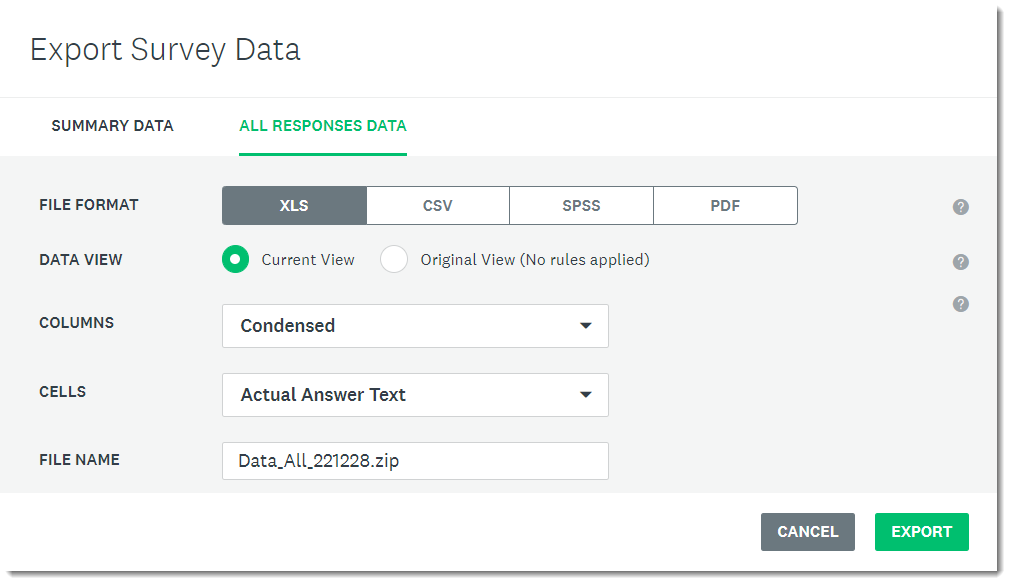
You need an Enterprise level license to access it, so I’ll walk through how you can get the data you need without having to upgrade your license.
Here’s are the settings you should use when you want to export the data as text responses.
And here’s a snippet of what the data looks like with text responses.
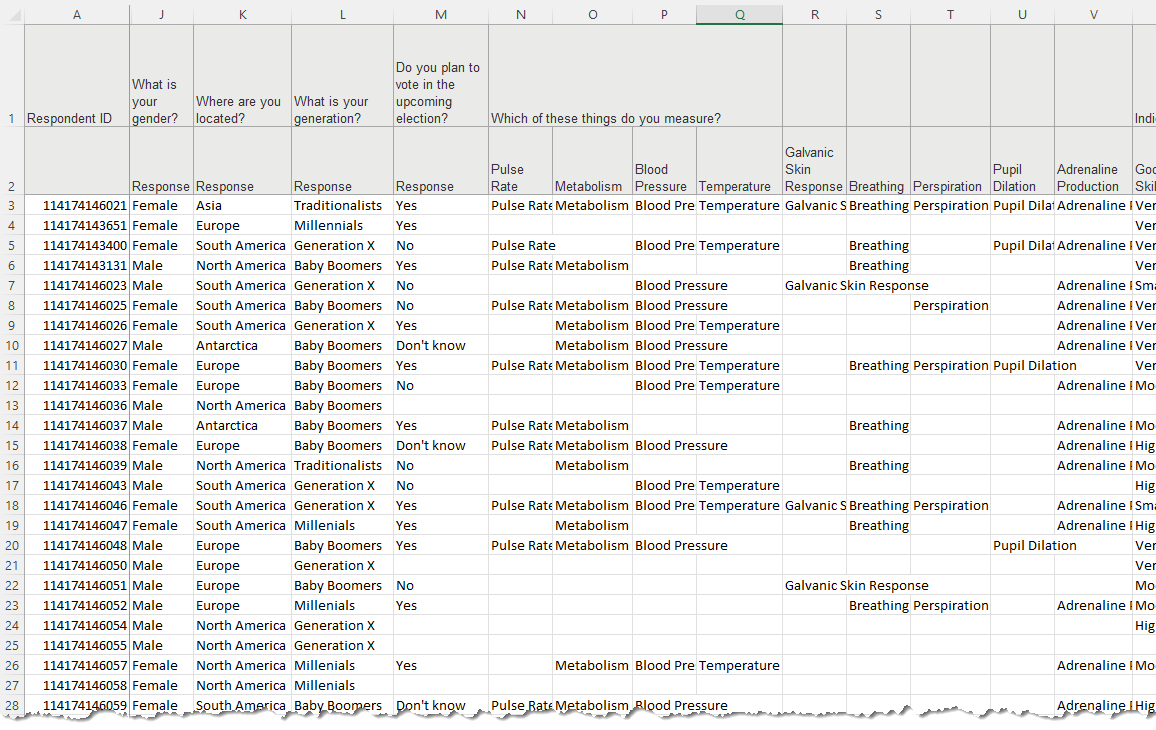
Do you see the issue with the header? There are two rows, and we need some stuff from the first row and some from the second (more on this in a moment).
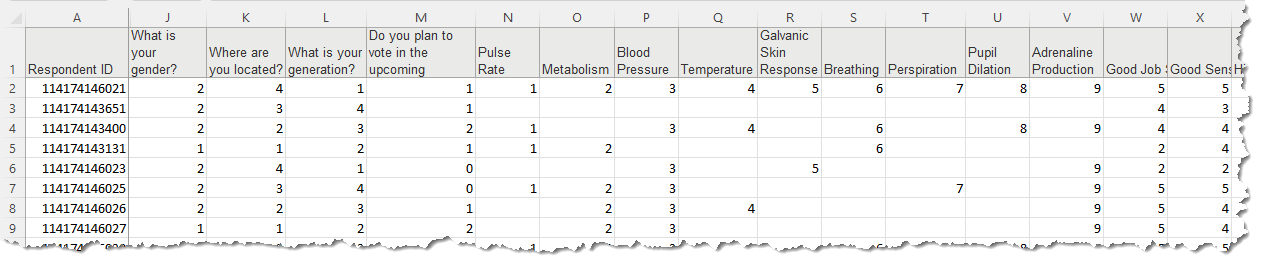
Here’s the same data in numeric format.
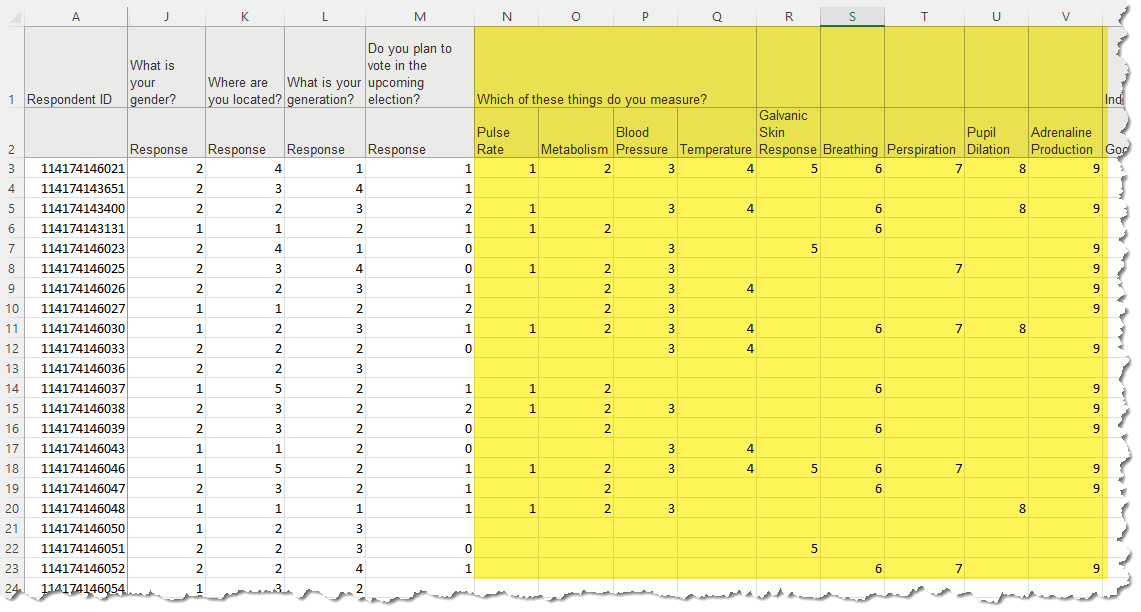
I’ve highlighted the check-all-that-apply questions. These should be 0s and 1s (no 2s, 3s, etc.), and there should only be blanks if a respondent skipped the question completely.
Addressing the header
As I noted before, there are some things in the first column we must have, some things in the second column we must have, and some things that will be useful for our “helper” file—the file we’ll create that has descriptive information about each question, which questions should be grouped together, and so on.
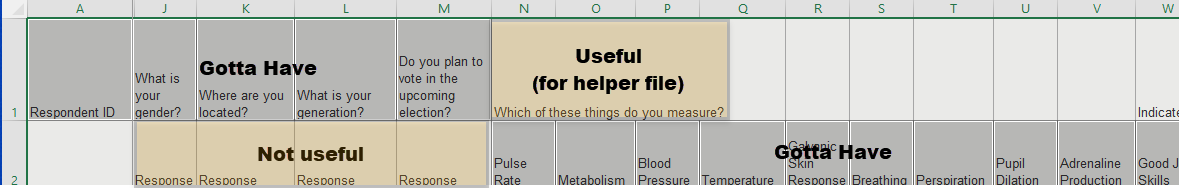
With a little copying and pasting we can fashion a single top row that looks like this.
Important: Make sure the other Excel file with the text version of the responses has the same single-row header.
Creating the Helper file
Now that we have the header setup it would be a good time to create the Helper file. Note that the Helper file is highly desirable, but not essential, as you can create ad-hoc groups and a lot of custom calculations in Tableau. That said, spending five minutes now will save us a few hours later.
Here’s how to build the file.
- Copy the questions / columns that you will eventually be pivoting. We’ll select everything except the Response ID field, the date fields, and the “demographic” questions. You can also pivot the demographic questions and have some questions that are both pivoted and un-pivoted, but we’ll save this for another discussion.
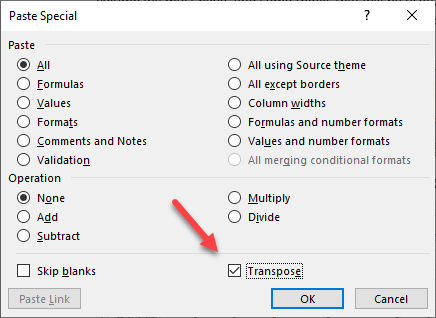
- In a new Excel file, select cell B2, then click the Down arrow below the Paste icon on the Ribbon and select Paste Special.
- In the Paste Special dialog box, make sure Transpose is selected.
- The pasted data will look like this.
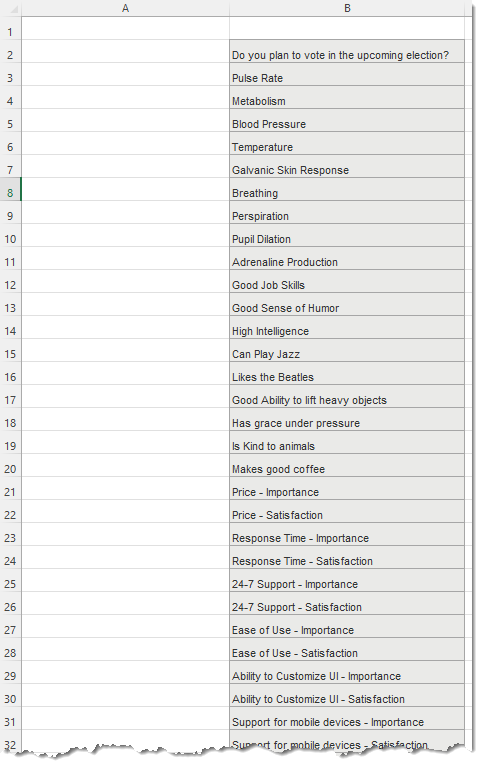
- Fill in the rest of the spreadsheet so that it looks like the one below and save the file.
Combining the files using Tableau Prep
At this point our source files are very similar to the source files I used for my “just so” blog posts. The major difference is that with SurveyMonkey data we don’t have Question IDs.
As I recommend in both the whitepaper and “just so” blog posts, we’ll combine the demographic data along with reshaped text responses and reshaped numeric responses. We’ll then combine these with the Helper file metadata.
To Start Tableau Prep and connect to the source data
- Start Tableau Prep Builder and click Connect to Data.
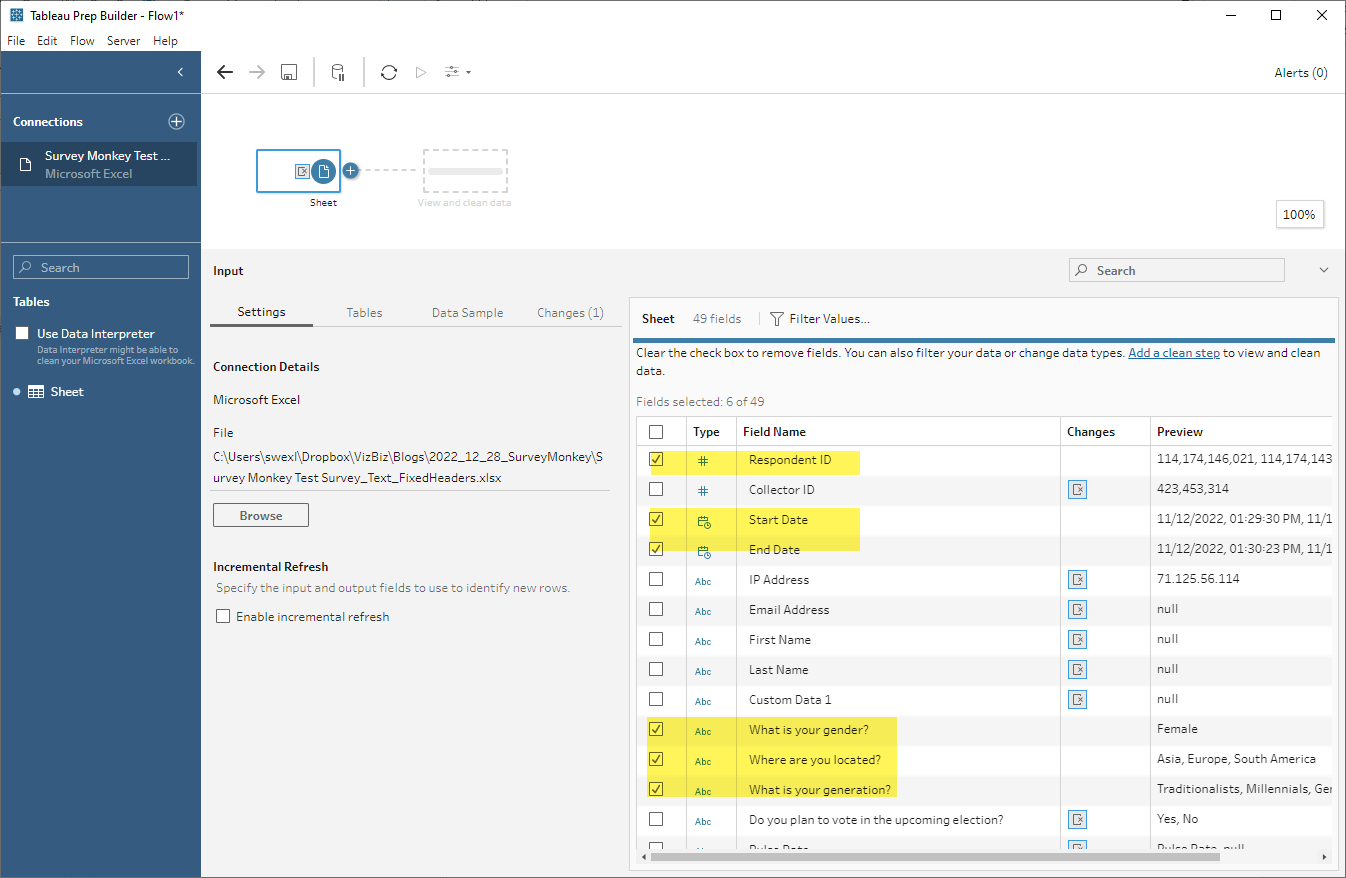
- Select Microsoft Excel from the To a File list.
- Select the file you want to work with first, in this case Survey Monkey Test Survey_Text_FixedHeaders.xlsx, and click Open.
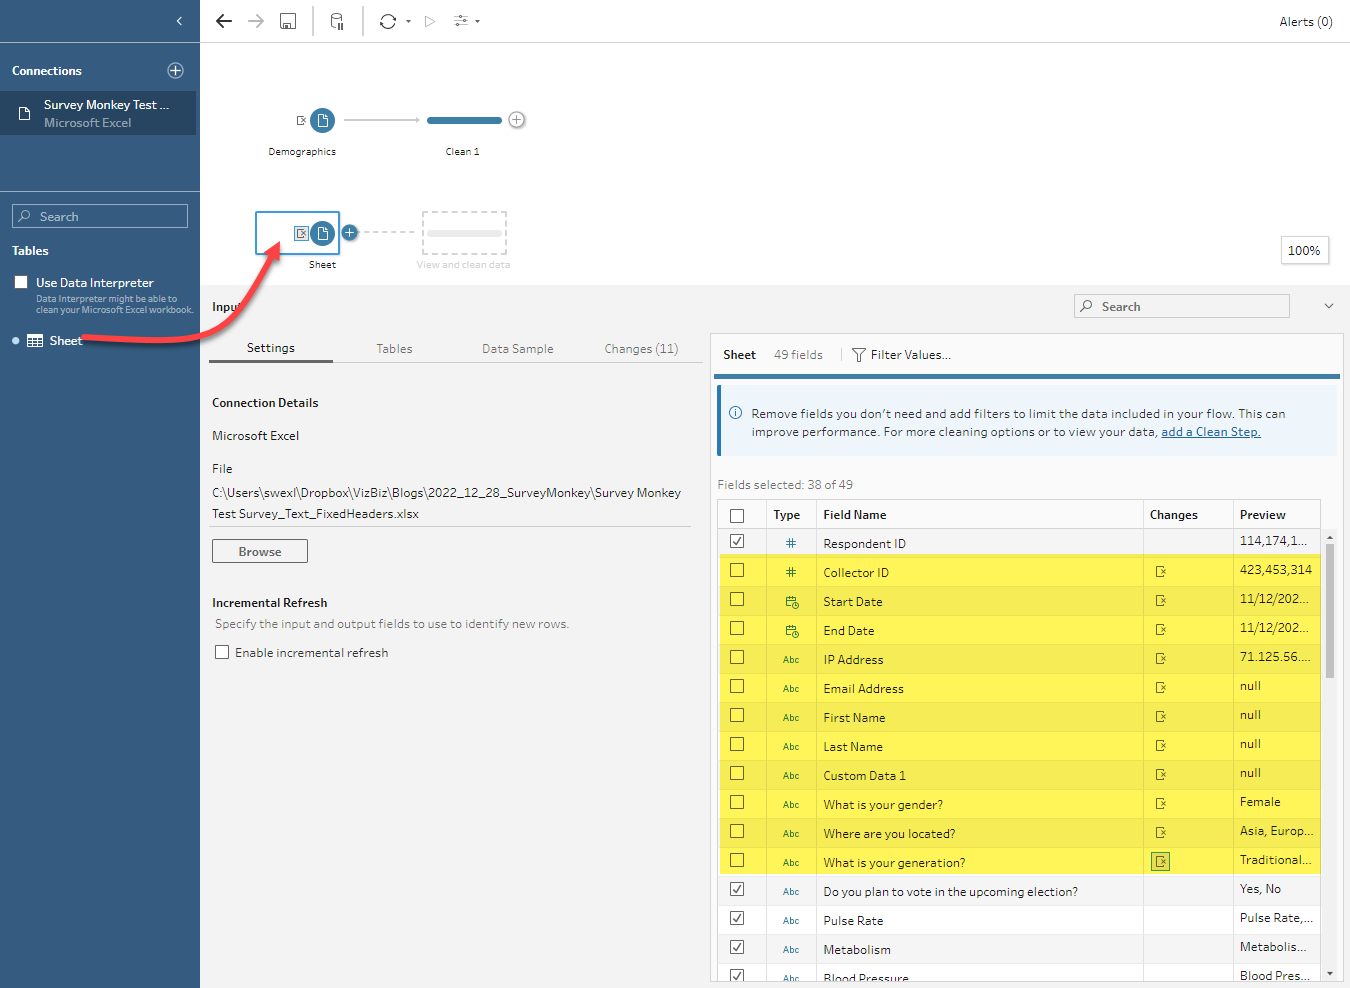
To Specify the Demographic Components
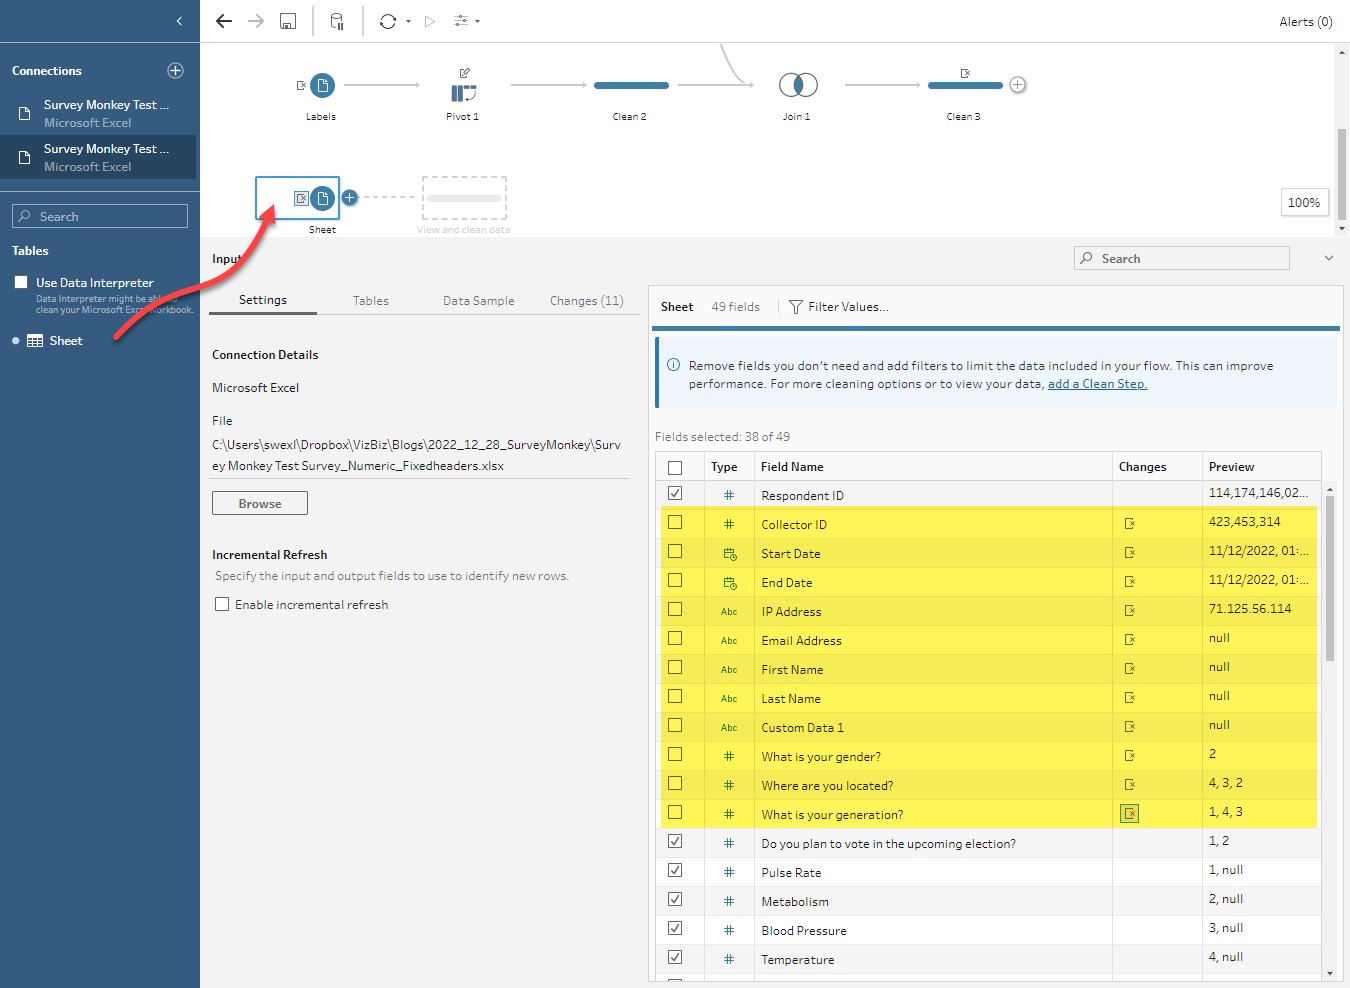
- As there is only one tab in the source Excel file, Tableau Prep will load in data from that sheet.
- Indicate the fields you want to include; e.g., Respondent ID, the demographic fields, and the date fields (if you will need them) as shown below.
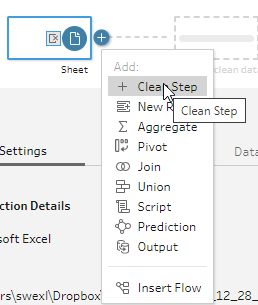
- Click the “+” sign next to the Sheet step and indicate you want to add a Clean Step.
- Right-click first step and rename it Demographics. Your screen should look like the one shown below.
Inspecting the Merchandise
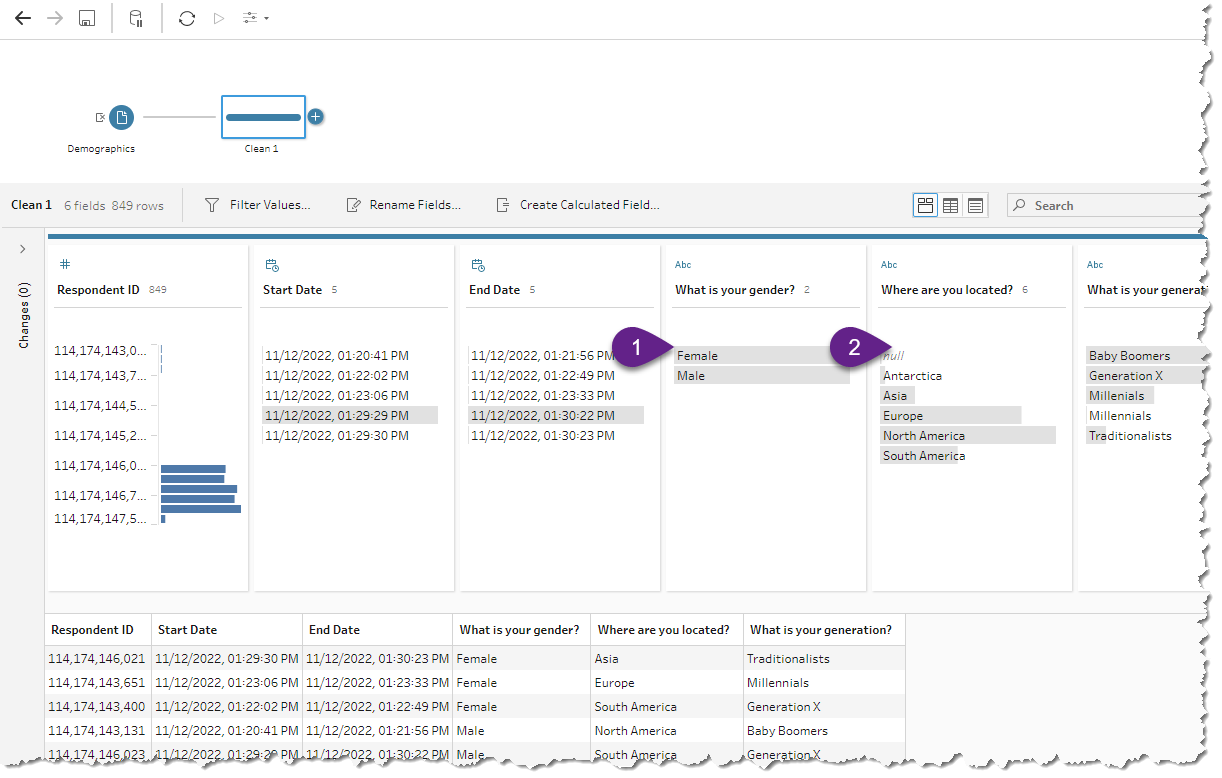
Note that you can now see both a profile view and a data grid view.
Look at the stuff in the middle! You can see a distribution of all the responses to each question before you even analyze things in Tableau! For example, we can see that more men than women took this survey (1) and that there were a handful of people that did not specify where they live (2).
To Import and Reshape the Label Responses
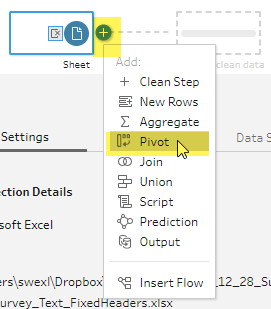
- Drag Sheet data source into the data area a second time and indicate that you do not want to include the demographics fields (although you CAN include them if you want to pivot them along with the other questions), as shown below. Make sure that you DO include Respondent ID.
- Click the “+” sign and indicate you want to add a Pivot.
- Drag all of the fields except Respondent ID into the Pivot1 Values area.
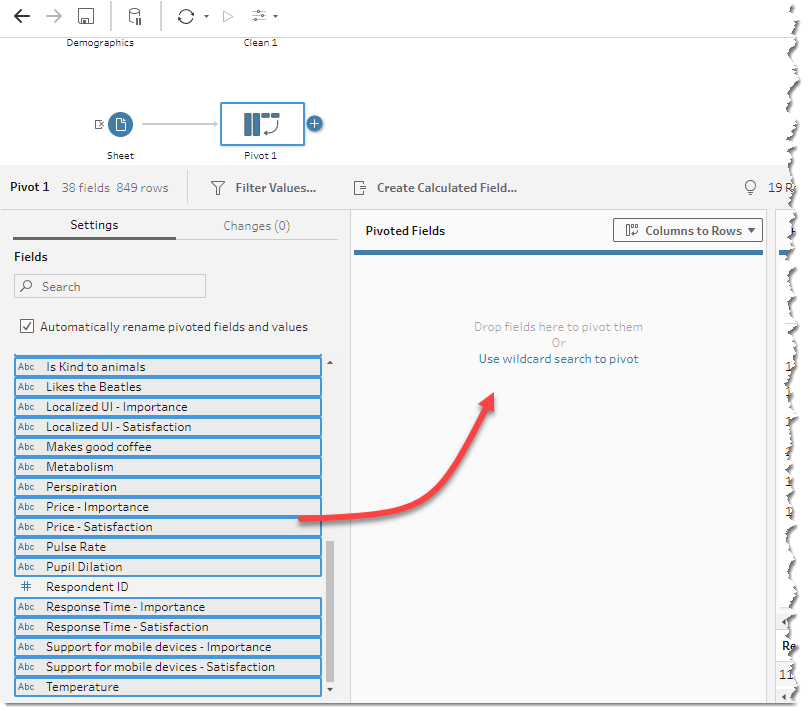
- Right-click the Pivot1 Names field and rename it Question Wording.
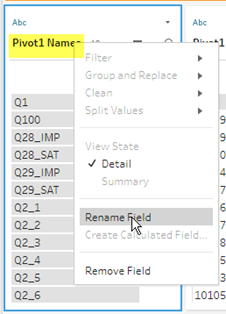
- Right-click the Pivot1 Values field and rename it Labels.
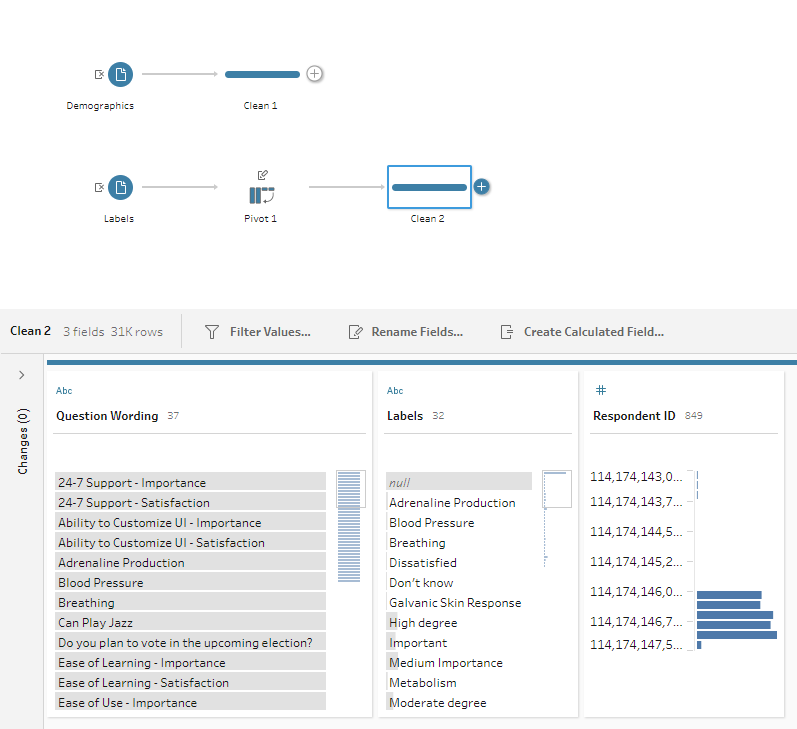
- Add a Clean Step. Your screen should look like the one shown below.
To Join the Demographic and Reshaped Label Data
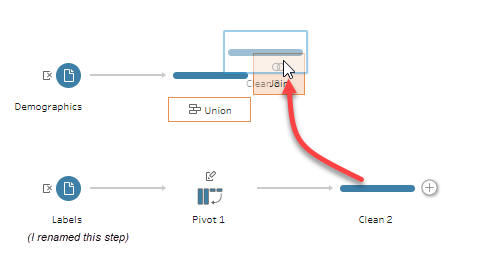
- Drag the Clean 2 step to the right of the Demographics step and indicate you want to do a Join.Tableau will guess that you want to perform an inner join on the Respondent ID field (this is indeed what we want to do.)
- Indicate you want to add a Clean Step after the Join 1 step.
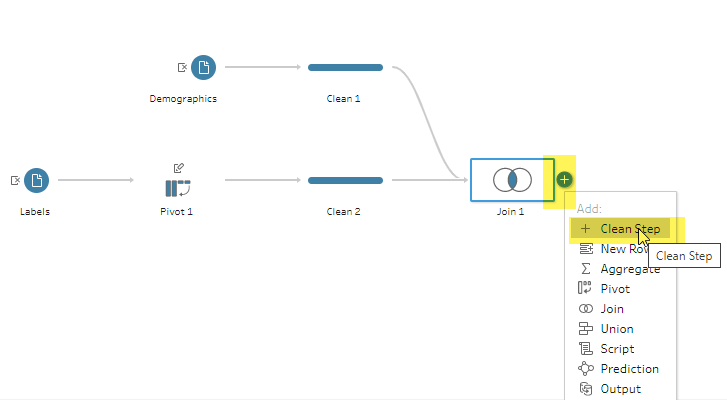
- Find the Respondent ID-1 field (it’s probably all the way to the right), right-click it, and indicate you want to Remove it.
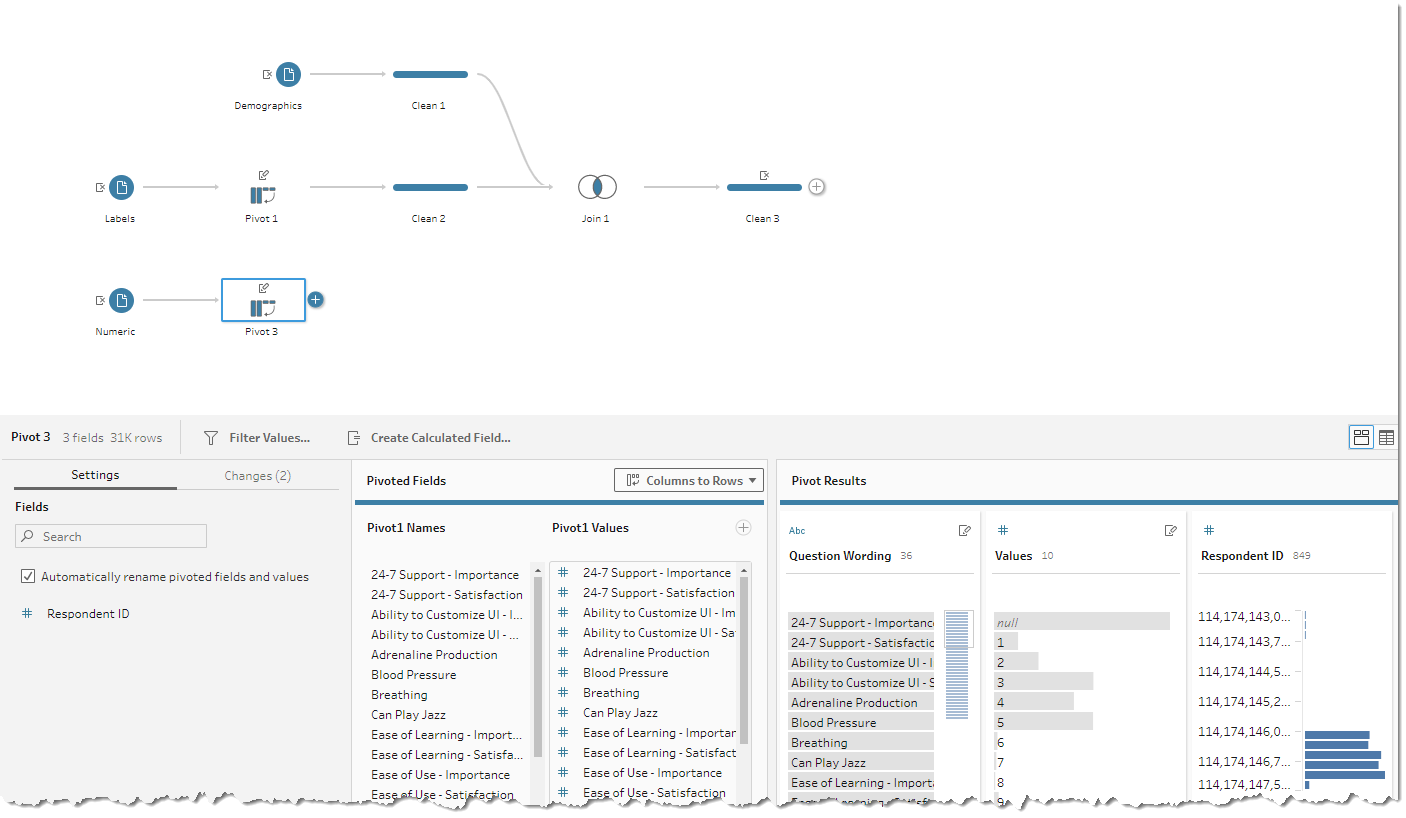
To Import and Reshape the Numeric Survey Responses
- Indicate you want to connect to a new data source by clicking the Plus sign net to Connections.

- Open the file Survey Monkey Test Survey_Numeric_Fixedheaders.xlsx and deselect the demographic fields.
- Click the “+” and indicate you want to add a Pivot.
- Drag all the fields except Respondent ID into the Pivot1 Values area.
- Rename Pivot2 Names to Question Wording.
- Rename Pivot2 Values to Numeric Values. Your screen should look like the one shown below.
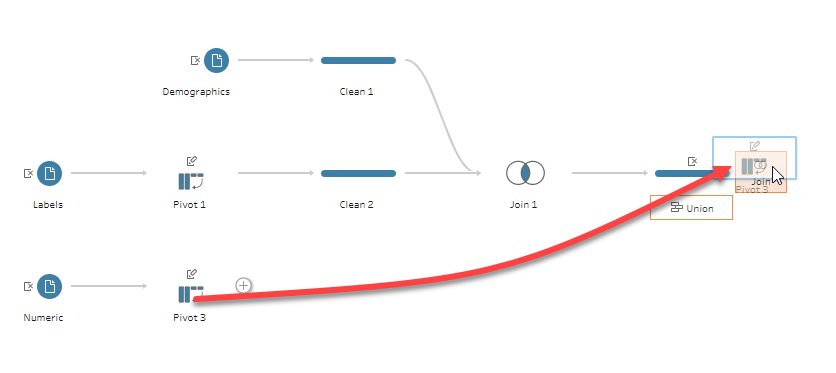
To Join the Demographic, Label, and Numeric Data Together
Now that we have both the text and numeric results pivoted / reshaped we need to merge the data so that all the numeric responses line up with all the text responses. That is, for every Respondent ID we want to make sure the text and numeric responses for each Question response lines up properly.
We’ll do this by joining the two reshaped data sources on two fields.
- Drag the Pivot step in the Data Numbers flow to the right of the last step in the first Data Labels flow. Note that we need to join on both Respondent ID and on Question ID.
- Click the “+” sign next to Applied Join Clauses.
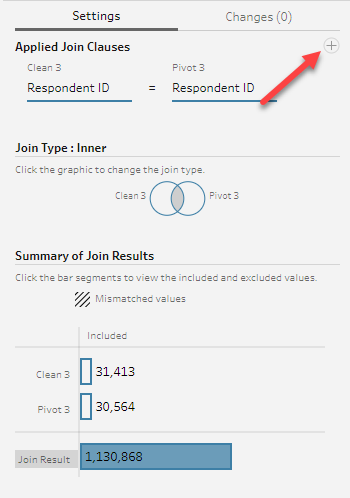
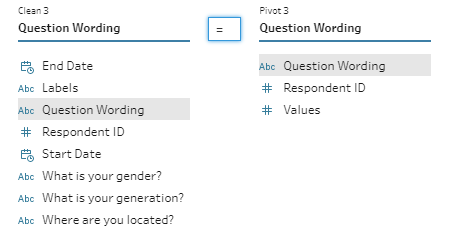
- Indicate that you also want to join Question Wording from Clean 3 with Question Wording from Pivot 3, as shown here.
- Add a new step and remove the unnecessary fields Question ID-1 and Respondent ID-1.
Note: You can rearrange the order of the fields by dragging them left and right. This would just be to help you understand the data; Tableau and Tableau Prep don’t care about the field order.
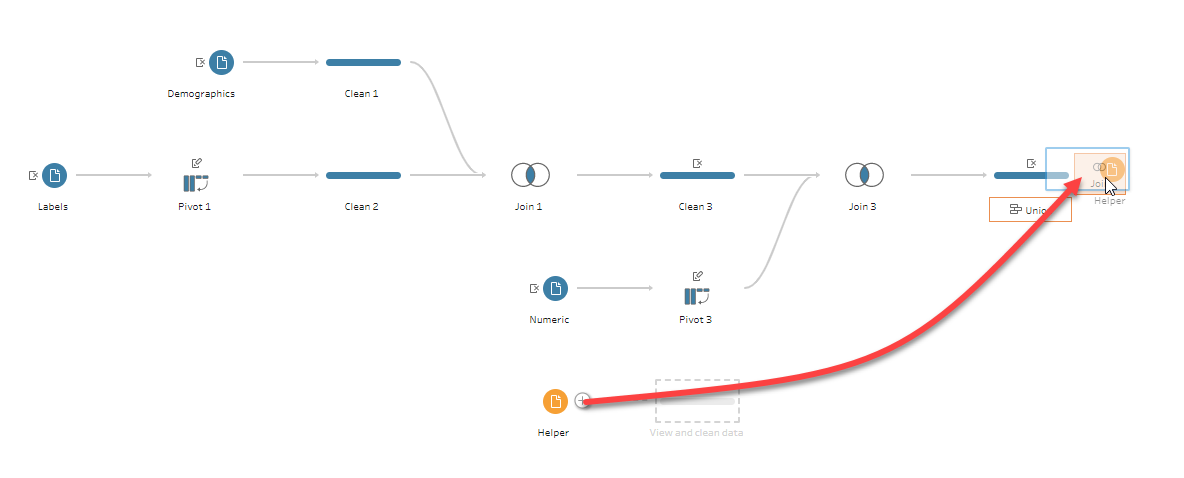
To Import and Connect to the Meta Info (the Helper File)
- Create a new connection and open the Excel file xlsx.
- Drag the Helper step to the right of last Clean step. Tableau Prep will join on Question Wording from the Helper file with Question Wording with the last Clean step.
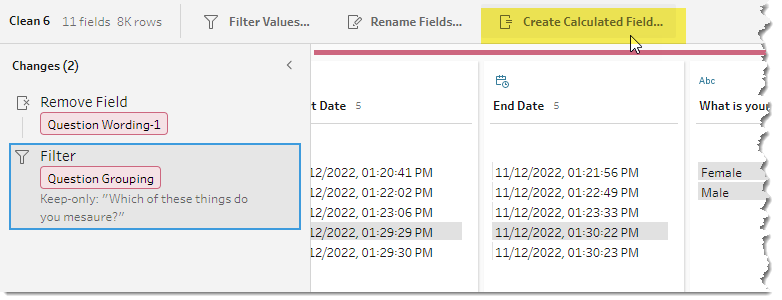
- Add a new step and remove the redundant field Question Wording-1.
- Save your work.
Fixing the Check All questions
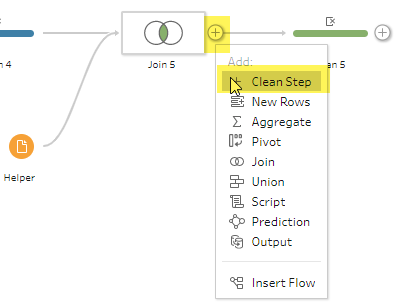
Let’s create a new branch to the flow that focuses only on the check-all-that-apply questions. We do this by clicking the plus sign right next to the Join 5 box and adding a Clean Step. (In older versions of Tableau Prep there was an Add Branch option.) Note that there are several places where a plus sign is available for adding a Clean step. Selecting the plus sign right next to the item will add the branch.
Here’s what the resulting flow looks like.
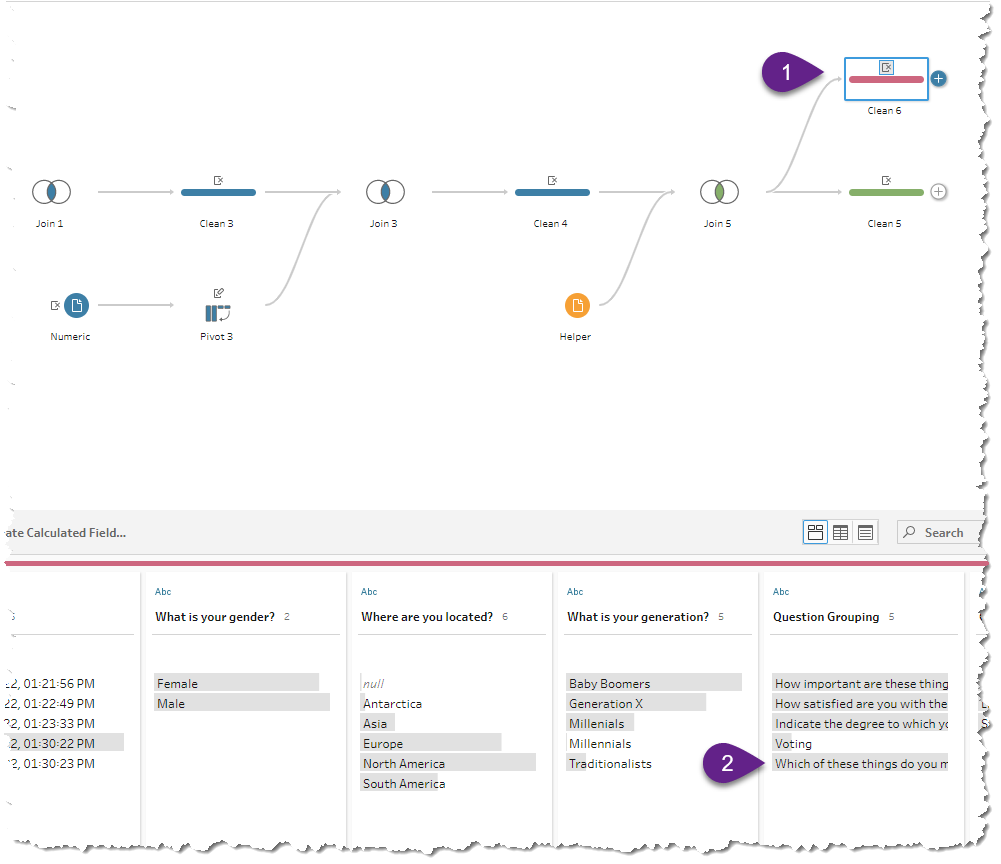
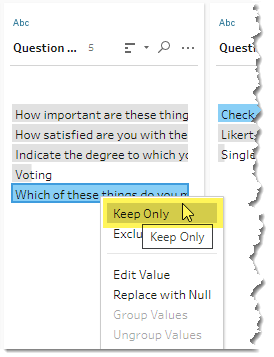
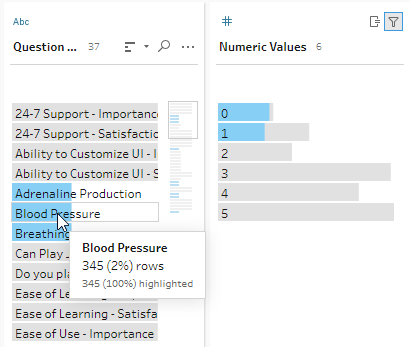
Since we only want to address responses to the “Which of these things do you measure” questions, we can right-click this in the profile pane (2) and select Keep Only.
To Convert any values greater than or equal to 1 to 1
You may recall our goal is to have 1s for items that were selected, 0s when items are not selected, and blanks when a respondent skipped the question altogether.
Let’s start by converting the 2s, 3s, etc., into 1s. We can do this by creating a new field called Numeric Values that modifies the pre-existing Numeric Values field.
- Within the branched Clean step, click Create Calculated Field.
- Name the field Numeric Values. Tableau Prep will point out that a field with this name already exists.
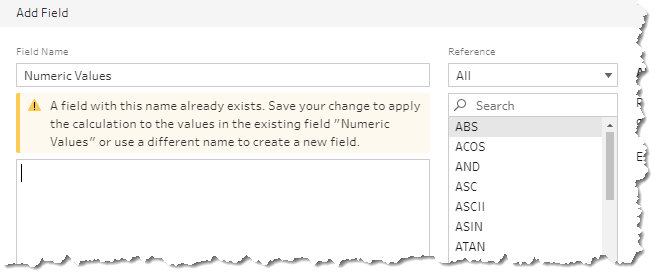
- Define the new [Numeric Values] field as follows:
IF [Numeric Values]>=1 THEN 1 ELSE [Numeric Values] END
This will convert any value greater than 1 in the Check All questions to a 1.
Adding up all the 1s
We’ll now add an aggregation that will take the sum of the Numeric Values for each respondent for the nine possible check-all-that-apply questions. The maximum value will be 9, meaning a person selected all nine things. A null means a respondent didn’t select anything.
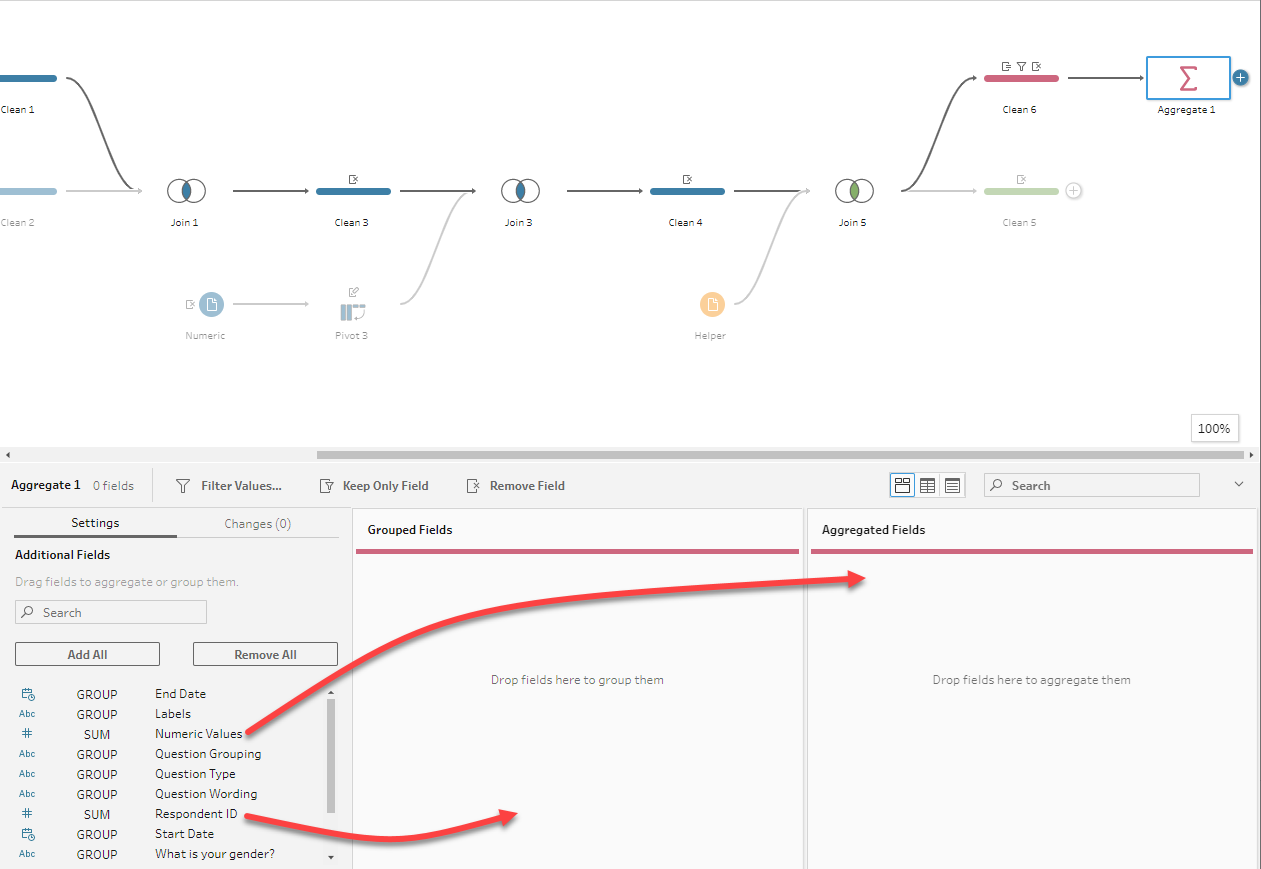
To add the aggregation, we’ll select the Plus sign next to the just-created Clean step and select Add Aggregate.
We now need to drag Respondent ID into the Grouped Fields area and Numeric Values into the Aggregated Fields area, as shown below.
When we examine the result, we can see that 504 people didn’t answer the question at all.
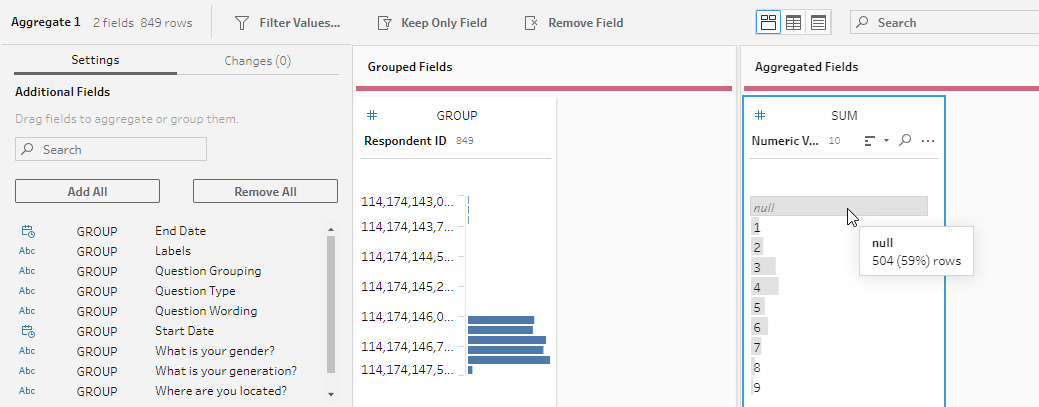
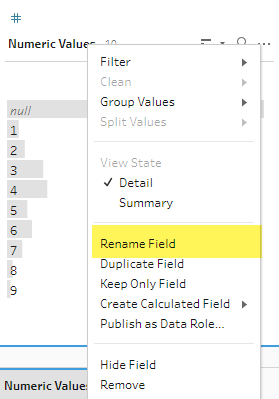
So now we know how many people didn’t check even one response. We also know how many selected one item, two items, etc. This knowledge may prove very useful down the road, so let’s give this aggregated result — which will become a new field in our database — a useful name (e.g., “HowManyChecked”.)
We can do this by adding a Clean Step right-clicking Numeric Responses and selecting Rename Field.
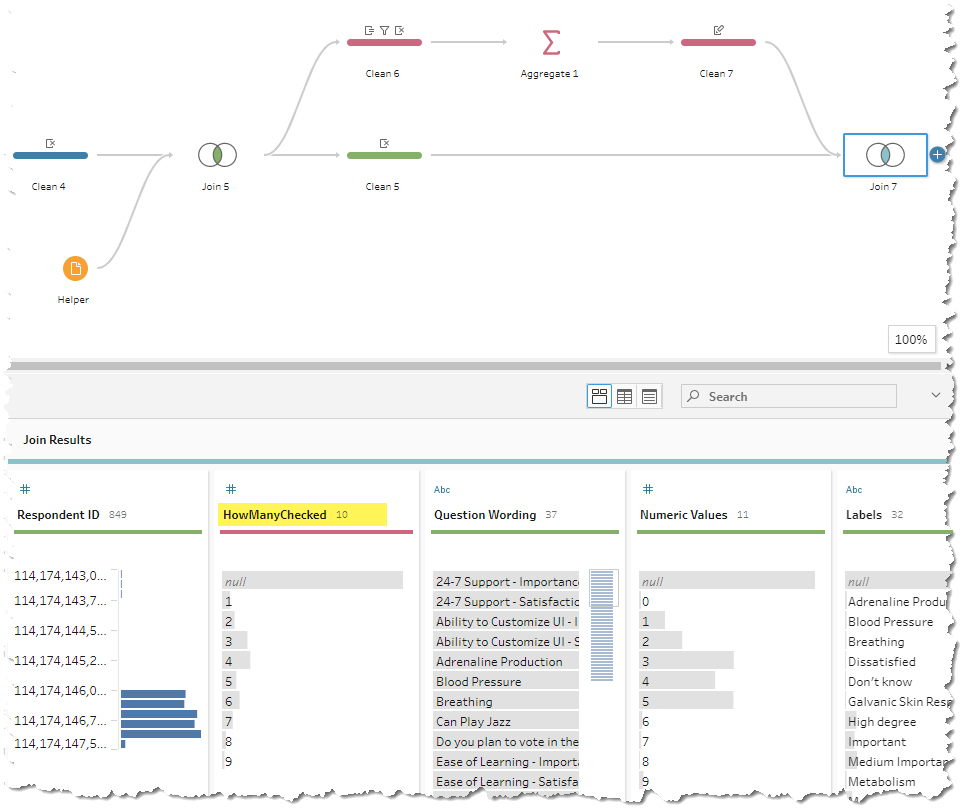
Merging the aggregated data back into the main flow
We’ll now merge the aggregated data into the main flow by dragging the Clean step to the right of the last step in the main flow and selecting Join, as shown here.
Tableau knows to join the two data sources (the main branch and the just-created sub-branch) on Respondent ID).
Here’s the merged data showing with our shiny new field, HowManyChecked.
Replacing the blanks with zeros (for only those blanks that should be replaced with zeros)
We’ll create a “new” field that addresses the nulls problem by adding a new step and then selecting Create Calculated Field from the header in the profile pane.
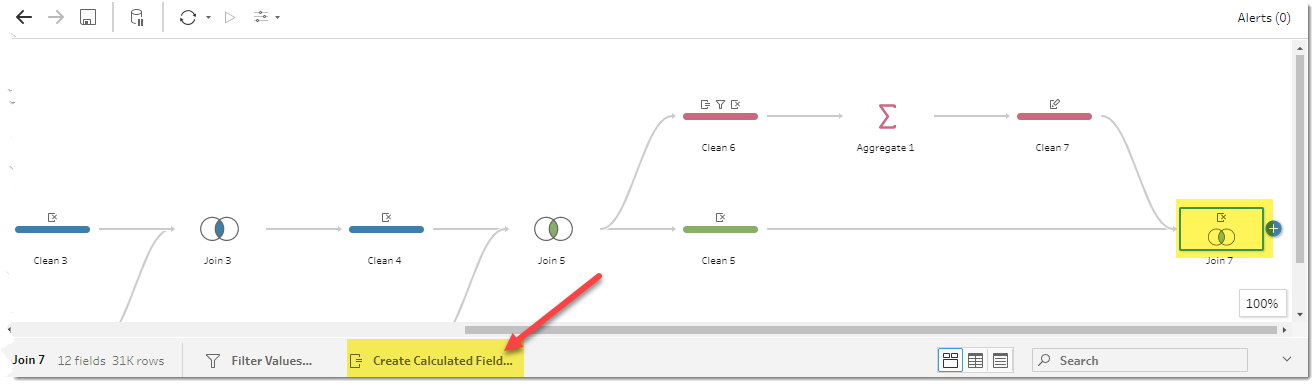
The “new” calculated field will be called [Numeric Values]. Again, we already have a field by that name. In creating this field, we are in fact just modifying the existing field.
Here’s the calculation that will do our bidding:
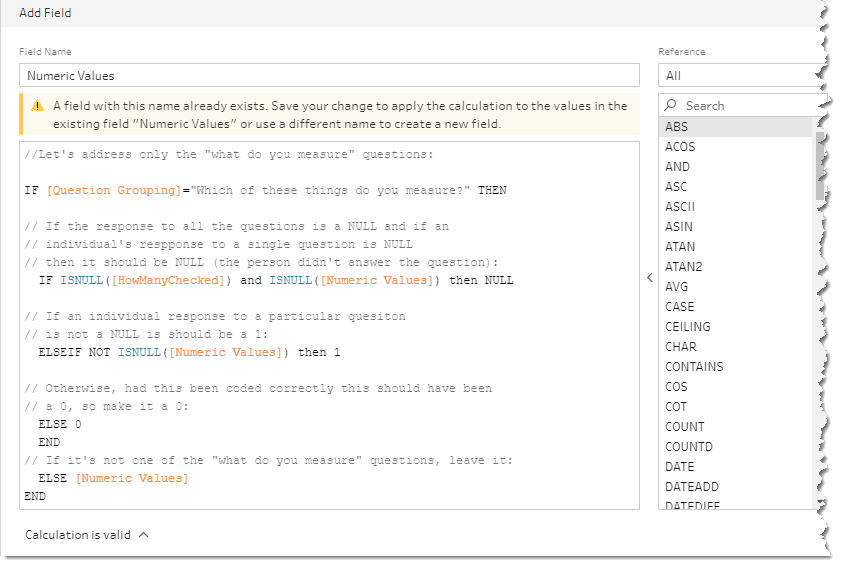
And here’s the code in case you want to copy and paste it.
  //Let's address only the "what do you measure" questions:
IF [Question Grouping]="Which of these things do you measure?" THEN

  // If the response to all the questions is a NULL and if an
  // individual's response to a single question is NULL
  // then it should be NULL (the person didn't answer the question):

IF ISNULL([HowManyChecked]) and ISNULL([Numeric Values]) then NULL

  // If an individual response to a particular questton
  // is not a NULL is should be a 1:

ELSEIF NOT ISNULL([Numeric Values]) then 1

  // Otherwise, had this been coded correctly this should have been
  // a 0, so make it a 0:

ELSE 0
END

  // If it's not one of the "what do you measure" questions, leave it:

ELSE [Numeric Values]
END
Translating this “Tableau-ese” into English:
Are we looking at a check-all-that-apply question?
If yes, then, If all nine options are blank (meaning that when you add them all together you get a null and each individual response is a Null) then leave it as Null.
If, however, one of the responses is not null, then item was selected, and it should have a value of 1.
If they are not all blank and the value isn’t 1, then make that null item a 0.
And if we’re not looking at check-all-that-apply question, leave everything alone.
Removing the Nulls
Now that we’ve converted the “I responded to this question” nulls to zeroes, we can remove all the nulls from our data.
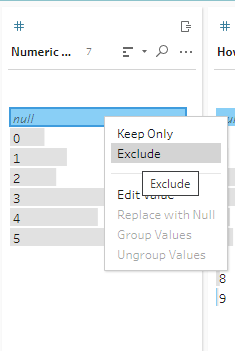
Indeed, if we inspect one of the check-all-that-apply question we can see that there were a total of 345 responses (849 survey takers, minus the 504 that didn’t answer the question) and that the Numeric Responses are all 1s or 0s.
If you’re wondering about the Text Responses, yes, we could convert the nulls to yesses, but we don’t need the Text Responses at all to compute a check-all-that-apply percent, so there’s little harm in leaving it as is.
Suppose you really want to keep those null values?
I tend to trim the data as much as possible, but if you want to keep the nulls you can do so, just make sure to apply a filter that removes them from inside Tableau.
But you still need to convert the nulls that should be zeros into zeros.
What’s left to do?
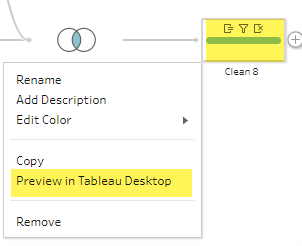
At this point we just need to output the resulting table. You can also get a quick preview in Tableau by right-clicking the last Clean step and selecting Preview in Tableau Desktop.
Note: if you download the packaged flow you’ll see that I created a calculated field called Number of Records. See this blog post for why you may find this valuable.
Conclusion (and a wish)
We saw in a related post that Tableau Prep can do great job of taking well-coded survey data and making it “just so.”
As we see here, Tableau Prep can handle poorly-coded data as well.
Don’t have Tableau Prep? You can download it here.
Want the packaged Tableau Prep Flow explored in this post? Click here to download it.
Care to see all the source files, including the unaltered data as downloaded from SurveyMonkey? Click here.
Here’s the wish: I mentioned SurveyMonkey’s web data connector earlier and that it’s good. I with the parent company, Momentive, would either make the connector much less expensive (how about free) or offer some download options that make it much easier to get CSV or Excel SurveyMonkey data into Tableau. Indeed, I look forward to when this blog post is obsolete.


