Overview
I received an e-mail inquiry about weighted data recently and realized that while I cover this in my survey data class I had not yet posted anything about it here. Time to remedy that.
The good news is that it is not at all difficult to work with weighted survey data in Tableau. And just what do I mean by weighted data? We use weighting to adjust the results of a study so that the results better reflect what is known about the population. For example, if the subscribers to your magazine are 60% female but the people that take your survey are only 45% female you should weigh the responses from females more heavily than males.
To do this each survey respondent should have a weighting amount associated with their respondent ID, as shown here.

Figure 1 – A snippet of survey data showing a separate column for Weight.
When pivoting / reshaping the data make sure that [Weight] does not get reshaped. It should remain in its own column like the other demographic data.
Once this is in place we’ll need to modify the formulas for the following questions types:
- Yes / No / Maybe (single punch)
- Check-all-that-apply (multi-punch)
- Sentiment / Likert Scale (simple stacked bar)
- Sentiment / Likert Scale (divergent stacked bar)
Yes / No / Maybe (single punch)
With this type of question you usually want to determine the percentage of the total.

Figure 2 — Visualization of a single-punch question
Unweighted calculation
The table calculation to determine the percentage of total using unweighted data is
SUM([Number of Records]) / TOTAL(SUM([Number of Records]))
Weighted calculation
The table calculation to determine the percentage of total using weighted data is
SUM([Weight]) / TOTAL(SUM([Weight]))
Check-all-that-apply (multi punch)
With this type of question you usually want to determine the percentage of people that selected an item. The total will almost always add up to more than 100% as you are allowing people to select multiple items.

Figure 3 — Visualization of a multi-punch question
Most surveys will code the items that are checked with a “1” and those that are not checked with a “0”.
Unweighted calculation
The calculation to determine the percentage of people selecting an item using unweighted data is
SUM([Value]) / SUM([Number of Records])
where [Value] is the name of the measure that contains the survey responses. If the survey responses are coded as labels instead of numbers you can use this formula instead.
SUM(IF [Label]="Yes" then 1 ELSE 0 END) / SUM([Number of Records])
Weighted calculation
The calculation to determine the percentage of people selecting an item using weighted data is
SUM(IF [Value]=1 then [Weight] ELSE 0 END) / SUM([Weight])
Sentiment / Likert Scale (simple stacked bar)
This is very similar to the single-punch question but instead we have several questions and compare them using a stacked bar chart. I am not a big fan of this approach but it can be useful when you superimpose some type of score (e.g., average Likert value, percent top 2 boxes, etc.).
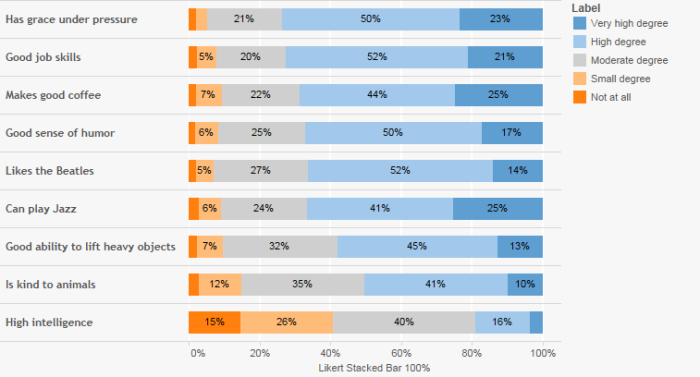
Figure 4 — Simple Likert Scale visualization

Figure 5 — Simple Likert Scale visualization with Percent Top 2 Boxes combo chart
Unweighted calculation – Stacked Bar
The table calculation to determine the percentage of total using unweighted data is
SUM([Number of Records]) / TOTAL(SUM([Number of Records]))
Weighted calculation – Stacked Bar
The table calculation to determine the percentage of total using weighted data is
SUM([Weight]) / TOTAL(SUM([Weight]))
Unweighted calculation – Percent Top 2 Boxes
Assuming a 1 through 5 Likert scale, the calculation to determine the percentage of people selecting either Very high degree or High Degree (top 2 boxes) using unweighted data is
SUM(IF [Value]>=4 then 1 ELSE 0) / SUM([Number of Records])
Weighted calculation – Percent Top 2 Boxes
Assuming a 1 through 5 Likert scale, The calculation to determine the percentage of people selecting either Very high degree or High Degree (top 2 boxes) using weighted data is
SUM(IF [Value]>=4 then [Weight] ELSE 0) / SUM([Weight])
Sentiment / Likert Scale (divergent stacked bar)
Here is what I believe is a preferable way to show how sentiment skews across different questions.

Figure 6 — A divergent stacked bar chart
I’ve covered how to build this type of chart using unweighted values here.
There are six fields we need to fashion the visualization, three of which need to be modified to make the visualization work with weighted data.
- Count Negative
- Gantt Percent
- Gantt Start
- Percentage
- Total Count
- Total Count Negative
Count Negative – Unweighted
Assuming a 1 – 5 Likert scale, the calculation to determine the number of negative sentiment responses using unweighted data is
   IF [Score]<3 THEN 1
   ELSEIF [Score]=3 THEN .5
   ELSE 0 END
Count Negative – Weighted
Assuming a 1 – 5 Likert scale, the calculation to determine the number of negative sentiment responses using weighted data is
   IF [Score]<3 THEN [Weight]
   ELSEIF [Score]=3 THEN .5 * [Weight]
   ELSE 0 END
Percentage – Unweighted
The calculation that determines both the size of the Gantt bar and the label for the bar using unweighted data is
SUM([Number of Records])/[Total Count]
Percentage – Weighted
The calculation that determines both the size of the Gantt bar and the label for the bar using weighted data is
SUM([Weight])/[Total Count]
Total Count – Unweighted
The calculation that determines the total number of responses for a particular question for unweighted data is
TOTAL(SUM([Number of Records]))
Total Count – Weighted
The calculation that determines the total number of responses for a particular question for weighted data is
TOTAL(SUM([Weight]))
Summary
Here’s a summary of all the unweighted calculations and their weighted equivalents
| Unweighted | Weighted |
| SUM([Number of Records]) / TOTAL(SUM([Number of Records])) | SUM([Weight]) / TOTAL(SUM([Weight])) |
| SUM([Value]) / SUM([Number of Records]) | SUM(IF [Value]=1 then [Weight] ELSE 0 END) / SUM([Weight]) |
| SUM(IF [Value]>=4 then 1 ELSE 0) / SUM([Number of Records]) | SUM(IF [Value]>=4 then [Weight] ELSE 0) / SUM([Weight]) |
| IF [Score]<3 THEN 1 ELSEIF [Score]=3 THEN .5 ELSE 0 END | IF [Score]<3 THEN [Weight] ELSEIF [Score]=3 THEN .5 * [Weight] ELSE 0 END |
| SUM([Number of Records])/[Total Count] | SUM([Weight])/[Total Count] |
| TOTAL(SUM([Number of Records])) | TOTAL(SUM([Weight])) |