Chart chat

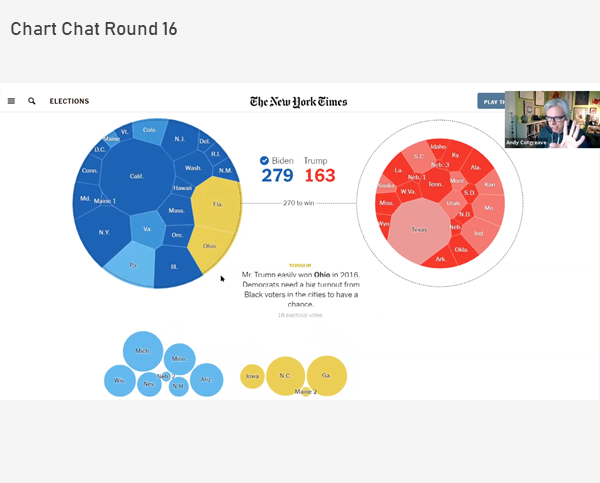
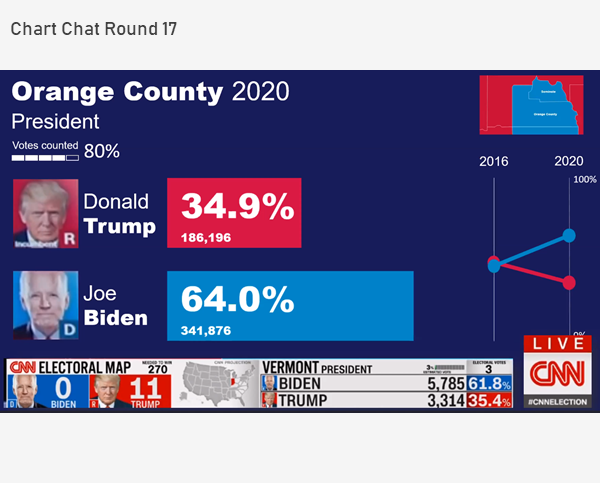
Chart Chat Live — Round 17

By |2020-10-25T23:15:00+00:00October 25th, 2020|, |

Watch as Jeffrey Shaffer, Steve Wexler, Amanda Makulec, and Andy Cotgreave, debate the good, the bad, and the “screaming cats” of data visualization. By tuning in you’ll learn how to apply their thought processes to your own work. You’ll be entertained, and you’ll build better data visualizations. Register

Chart Chat Live — Round 16

By |2020-09-30T18:48:03+00:00September 30th, 2020|, |

Watch as Jeffrey Shaffer, Steve Wexler, Amanda Makulec, and Andy Cotgreave, debate the good, the bad, and the “screaming cats” of data visualization. By tuning in you’ll learn how to apply their thought processes to your own work. You’ll be entertained, and you’ll build better data visualizations. Topic: 2020 Election Trackers Register

Chart Chat Live — Round 15

By |2020-06-08T16:29:34+00:00June 8th, 2020|, |

Watch as Jeffrey Shaffer, Steve Wexler, Amanda Makulec, and Andy Cotgreave, debate the good, the bad, and the “screaming cats” of data visualization. By tuning in you’ll learn how to apply their thought processes to your own work. You’ll be entertained, and you’ll build better data visualizations. Format: 5-minute recap, 20-minute presentation, 10-minute "lightning" round, [...]

Chart Chat Live — Round 14

By |2020-05-08T21:13:49+00:00May 8th, 2020|, |

Watch as Jeffrey Shaffer, Steve Wexler, Amanda Makulec, and Andy Cotgreave, debate the good, the bad, and the “screaming cats” of data visualization. By tuning in you’ll learn how to apply their thought processes to your own work. You’ll be entertained, and you’ll build better data visualizations. Format: 5-minute recap, 20-minute presentation, 10-minute "lightning" round, [...]

Chart Chat Live — Round 13

By |2020-04-16T17:31:25+00:00April 16th, 2020|, |

Watch as Jeffrey Shaffer, Steve Wexler, Amanda Makulec, and Andy Cotgreave, debate the good, the bad, and the “screaming cats” of data visualization. By tuning in you’ll learn how to apply their thought processes to your own work. You’ll be entertained, and you’ll build better data visualizations. Format: 5-minute recap, 20-minute presentation, 10-minute "lightning" round, [...]

Chart Chat Live — Round 11

By |2020-03-28T23:12:58+00:00March 26th, 2020|Business Visualizations, Chart Chat, Videos|

In this special Chart Chat Steve, Jeff, Amanda, and Andy try to give you the tools to parse and filter the barrage of data visualizations around the Coronavirus. We'll look at the history behind the "flatten the curve" diagram, why that curve is likely to be bumpy, how certain visualizations are truly helping people [...]

Title