
Overview
I’ve written almost ten years’ worth of blog posts on visualizing survey data using Tableau (see https://www.datarevelations.com/visualizing-survey-data/). The good news is that dozens of how-to articles that are currently on my website are relevant and the techniques work.
That said, Tableau made a HUGE change in how you can model data with the release of version 2020.2. With this release, a very useful field [Number of records] is no longer created automatically. This can be head-scratching if you try to apply the techniques and calculations in the how-to articles only to wonder “yes, but I don’t have that field available. What am I supposed to do?”
The good news is that the workaround for this is ridiculously easy.
What it looked like then, and what it looks like now
I use a standard data set for many of the examples in the how-to articles (you can find it here, assuming you can access DropBox). Here’s what how the data pane appears when you in Tableau 2019.4 vs. Tableau 2020.2 and later.
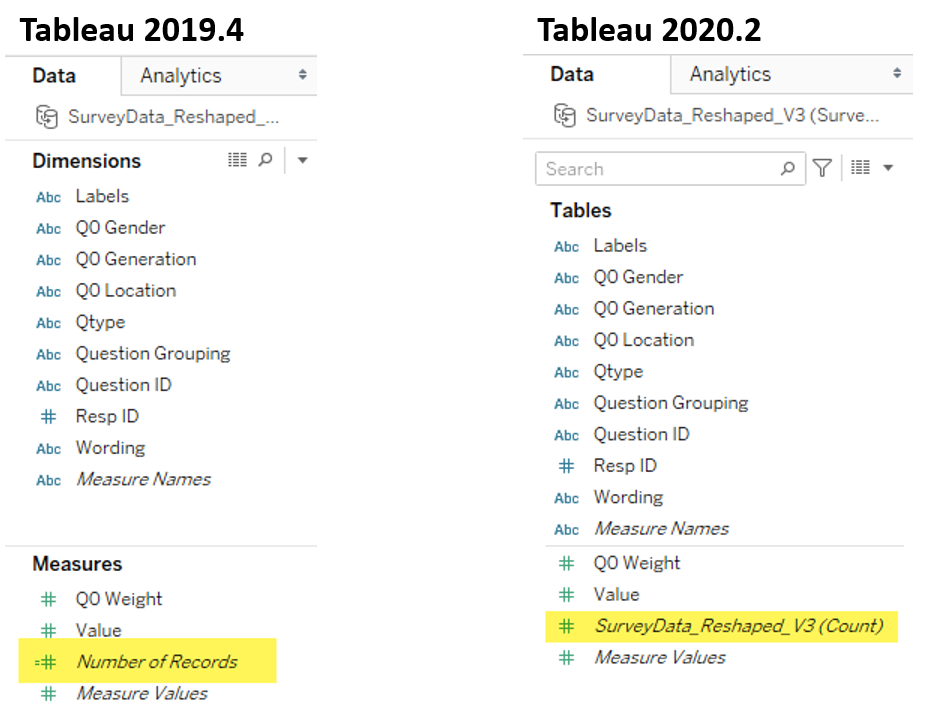
Figure 1 — Default fields in earlier versions of Tableau vs. 2020.2 and later
So, what happened to [Number of Records] and how do you make all the how-to articles that reference that field work?
Making all the how-to articles work
Let’s say you’re reading the article “How to visualize check-all-that-apply questions using Tableau” and you see this formula.
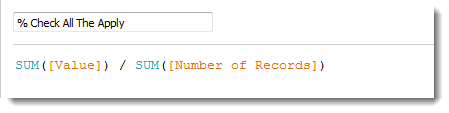
Figure 2 — How to determine the percentage of people that selected an option.
What are you to do?
The easiest thing to do is to “roll your own” [Number of Records] field and define it as follows.
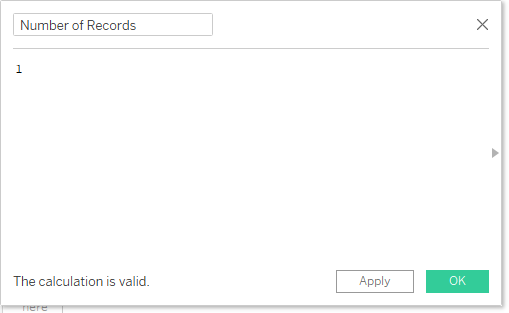
Figure 3 — Create a new field called Number of Records and define it as the number 1.
Yes, that’s all there is to it. This field places a “1” in every row of your source data so Tableau will add up all the relevant rows to get the correct denominator when it performs the % Check All That Apply calculation.
Important: This works if you follow my advice on getting your data “just so” using Tableau Prep Conductor, Alteryx, EasyMorph, etc. This will not work if you start noodling with Tableau’s new Relationship model (aka, “the noodle”). Indeed, we need to use Tableau’s Relationship feature if you want to breakdown questions by check-all-that-apply questions. In cases like that one I suggest adding the field using your data prep tool of choice.
In case you are curious…
What is the Tableau 2020.2 (and later) equivalent of SUM([Number of Records])? It’s COUNT([Whatever the generated name is]). This means that both calculated fields will yield the same results for this data set.
Specifically…
SUM([Value]) / SUM([Number of Records])
Is the same as
SUM([Value]) / COUNT([SurveyData_Reshaped_V3])


