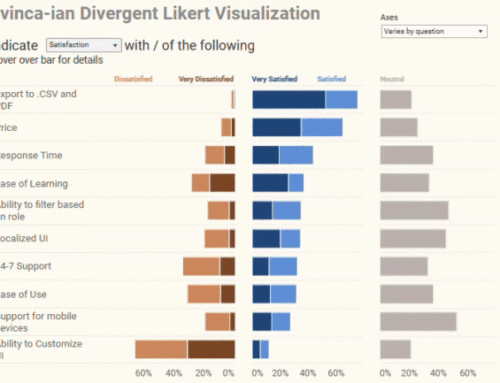
Overview
You can download a trial version of Alteryx here.
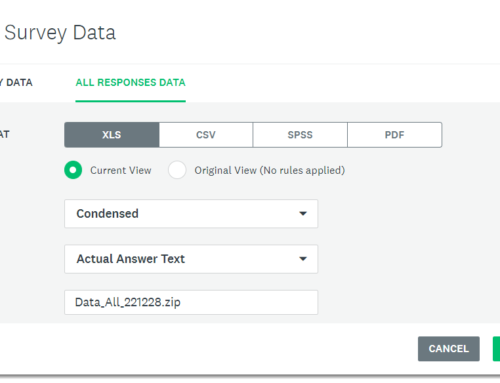
You can find the Excel source data here.
You can download the completed Alteryx module from here.
Understanding the workflow
Here’s the Alteryx workflow that will get the data in the format we want.
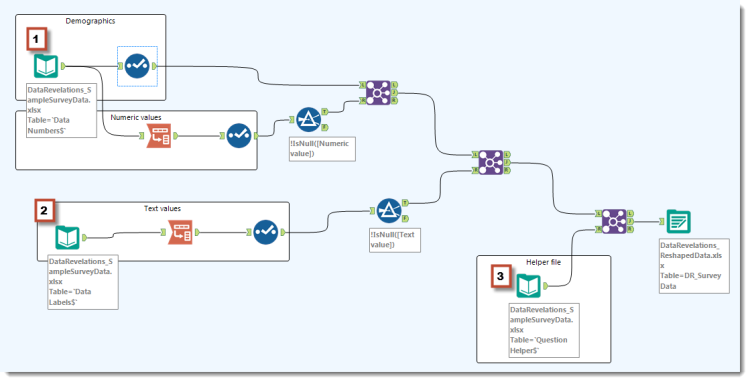
Figure 9 — Alteryx workflow for getting the survey data in an optimal format for analysis in Tableau
If this is the first time you’ve seen an Alteryx workflow it may look a little complicated (shades of Rube Goldberg) but think about how complicated the flow and decision tree is for what you do when you get up in the morning and get ready for work – it’s way more complicated.
Let’s start by focusing on the three data sources that we need (labeled 1, 2, and 3 in the diagram above).
- Data with numeric responses (we’ll use this for our demographic data, too)
- Data with text responses
- The Question Helper file (contains our meta data).
A note about SPSS files
For this example we’re using Excel data but the process would be identical for survey data saved in an SPSS format (.SAV file). SPSS encodes both the text and numeric data in a single file, but you need to input values from that same data source twice – once for text and once for numeric values.
When you specify an SPSS file as a data source you’ll see the following check box option.

Figure 10 — Options that appear when you bring in data from an SPSS file.
Selecting “Expand Factors” will bring in the data as labels. Unchecking this box will bring in the data as numbers.
Demographics

Figure 11 — Selecting the demographic components from the data source
Clicking the Select tool reveals the following settings.

Figure 12 — Specifying which fields we want to keep
A translation into English would be “open this Excel file and select these fields”. Here we keep RespID, Gender, Location, Generation, and Weight.
Numeric values

Figure 13 — Numeric values section of the Alteryx workflow with the Transpose tool selected
Using the same data source, selecting the Transpose tool reveals the following settings.

Figure 14 – Transpose tool settings
Here we indicate that we want to keep RespID and pivot all the other checked fields. Notice that the demographic components are not checked.
Looking back to the workflow diagram, we next follow this pivot with a Select tool which we use to rename the pivoted fields as shown here.

Figure 15 — The Select tool allows us to name the pivoted fields
Here we are naming the first pivoted field Question ID and the second pivoted field Numeric value.
Dealing with nulls

Figure 16 — The Filter tool allows us to eliminate null values before they hit Tableau.
While not critical, Alteryx allows us to eliminate null values before they come into Tableau. Here’s the setting for this tool.

Figure 17 — Setting to eliminate nulls from the Numeric value field
Joining the demographic with the transposed (pivoted) numeric data

Figure 18 — Joining the demographic and transposed numeric data
We’re now ready to join the demographic data with the pivoted numeric survey data. We do this with Alteryx’s Join tool. Here are the settings.
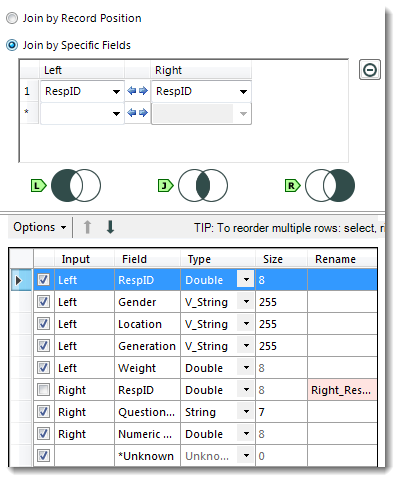
Figure 19 — Joining demographics and numeric data using the common field, RespID. Notice that we don’t include the redundant version of RespID that is coming from the right table.
Checking our progress
If we add a Browse tool after the Join we’ll see the following results.
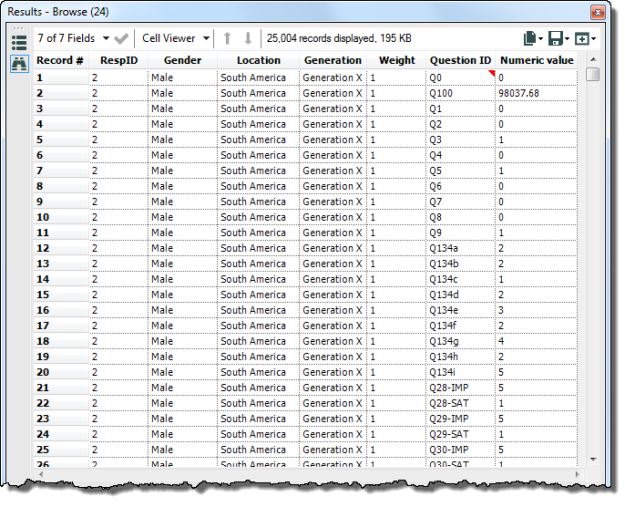
Figure 20 — Results of the initial Join
Note that we could, in fact, get by with using just this in Tableau, but the whole point is to make things faster and easier, so we’re going to add text responses and the “Helper” data.
Text Values

Figure 21 — Workflow for setting the text values
This is identical to the numeric values except that we specify a different data source (one with label responses instead of numeric) and we rename the second pivoted field differently, as shown here.

Figure 22 — The Select tool allows us to name the pivoted fields
Here we are naming the first pivoted field Question ID and the second Text value.
Tying Demographic, Numeric and Text Values Together
We need to combine the demographic / numeric values with the text values. We will again use Alteryx’s Join tool, but we’ll need to join on both RespID and Question ID.
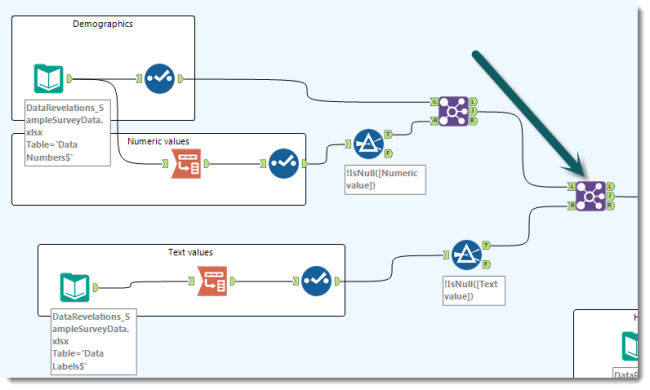
Figure 23 — Joining demographic, numeric, and text data together
The setting for the Join is shown below.

Figure 24 — Join settings for combining demographics / numeric with text data
Adding the question meta data and outputting the results
We’re almost done; we just need to add the information that tells us about each Question ID so we can map the ID to its human-readable form, group related IDs together, and so on.
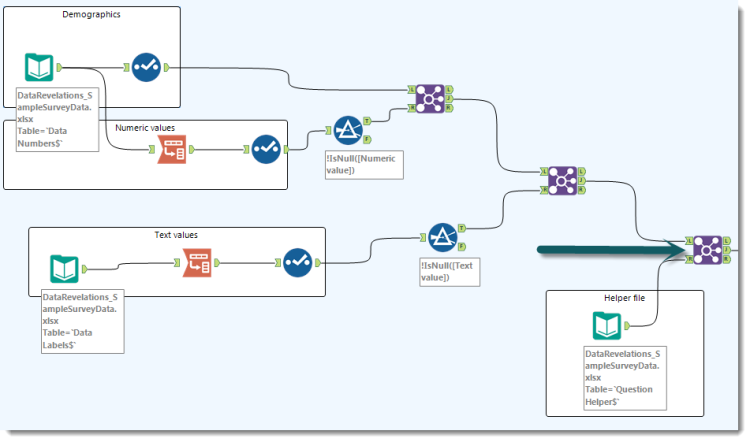
Figure 25 — Joining the “Helper” file data
The setting for this Join is shown below.

Figure 26 — Marrying the question meta data to the demographic and survey data
The only thing left to do is output this to a new data source. In the sample workflow I output to an Excel file but you can just as easily write directly to a Tableau Data Extract file.
But Wait! There’s More!
I intentionally used data that was well behaved, but what happens if the data is “messy”? For example, suppose there’s an extra row below the field names? Or suppose that for a check-all-that-apply question, instead of 1s and 0s we instead have 1s and blanks (which would mess things up in Tableau)? Alteryx handles both of these scenarios (and dozens more) easily.
Is there a Downside?
If there’s any downside it would be the cost as Alteryx starts at around $4,000 per year. If all you are doing is some occasional survey data reshaping then this fee would probably be prohibitively expensive. If, however, you need to corral a lot of data – or if you need advanced data blending, geospatial analysis, or predictive modeling – then Alteryx is a huge bargain.