January 3, 2018
Note: I first wrote about this five years ago and while the approaches I suggested then do in fact work, the advent of Level of Detail (LoD) expressions in Tableau gives us a much better way to get the job done. A very big "thank you" to my friend and colleague Jonathan Drummey who steered me very quickly to the flexible approach I write about below.
Overview
Those that have followed this blog know that when I setup survey data for analysis in Tableau I separate the so-called "demographic" questions (e.g., gender, ethnicity, education, political leanings, etc.) from the "what you want to know questions" (e.g., "would you recommend this company to a friend or colleague?", "which of these things do you look for when considering an insurance carrier?", etc.) The demographic questions remain as separate columns and the other questions get reshaped. So, you may start with 200 columns and 800 rows, with one row for each respondent, and you end up with 20 columns and tens of thousands of rows, with a separate row for each non-demographic question a respondent answered.
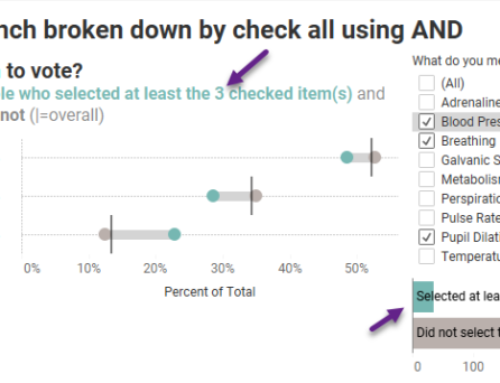
This is a solid, proven strategy, but suppose you want to filter / break down a survey question not by a demographic question, but by another "what you want to know" question? That is, suppose you want to see how folks that selected "Yes" to the question "Do you plan to vote in the upcoming election" responded to a Net Promoter Score question?
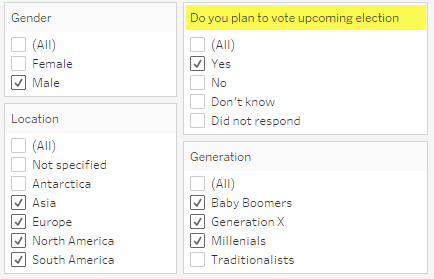
Figure 1 — A reshaped question acting as s "demographic" filter.
In this pair of blog posts we'll show you how any reshaped question can be "promoted" to behave like a so-called "demographic" question. That is, we will come up with a flexible, parameter-based approach that will allow any reshaped question to become a Tableau dimension that acts as if it were in its own column from the get-go.
A few thoughts before we plow ahead.
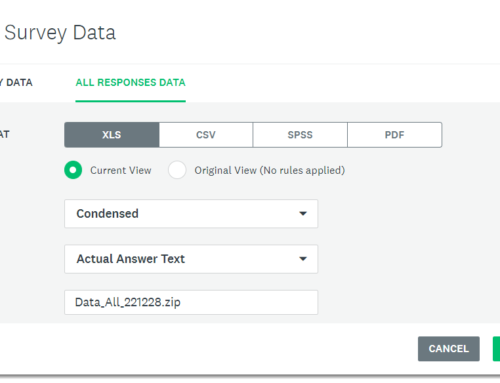
- I'll be using the same data set I've used for most of the examples I've blogged about and I will have prepped the data as described here.
- If you know which non-demographic questions warrant this treatment ahead of time you can certainly just copy them and make them separate columns before reshaping / pivoting, thus avoiding the techniques explained below.
- You can also join a reshaped data source to itself but his will produce an overabundance of rows.
- You can join the pivoted data to the unpivoted data and have tens of thousands of rows and hundreds of columns (but you and your audience will be miserable, and performance will be very slow).
A look inside Jonathan Drummey's thought process
As I was working with Jonathan he jotted down his thoughts in the spreadsheet that I show below.
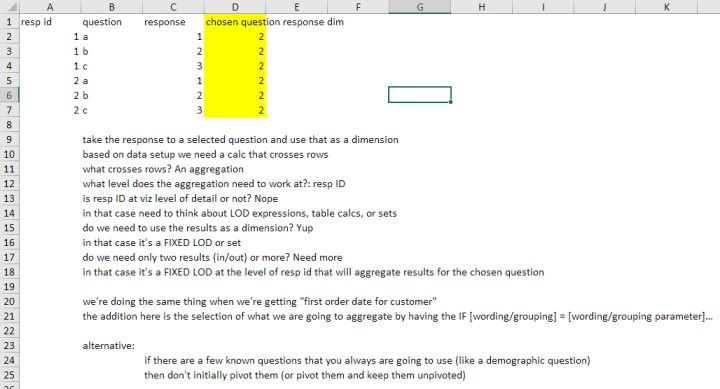
Figure 2 — How Jonathan Drummey approached the problem.
Pay particular attention to his thoughts expressed in rows 9 through 18. Here's a flowchart that Jonathan created that goes into more detail (in a slightly different order) about this process of identifying what kind of calculation is necessary:
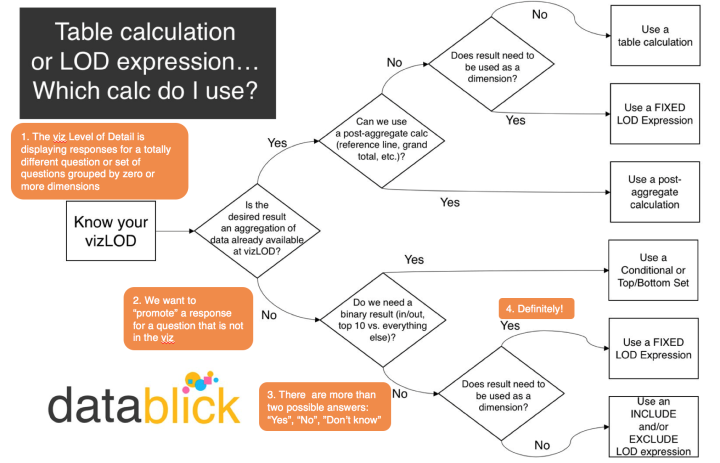
Figure 3 — Jonathan's flowchart for determining whether a Level-of-Detail expression or a Table Calculation is warranted.
Starting off easy: understanding our data
Before we come up with an extensible solution let's start by turning a single question–in this case "Do you plan to vote in the upcoming election" (Question ID = Q0)–and make it behave like a dimension. Here's a mapping of all the Question IDs, how they group, and the universe of responses to each question.
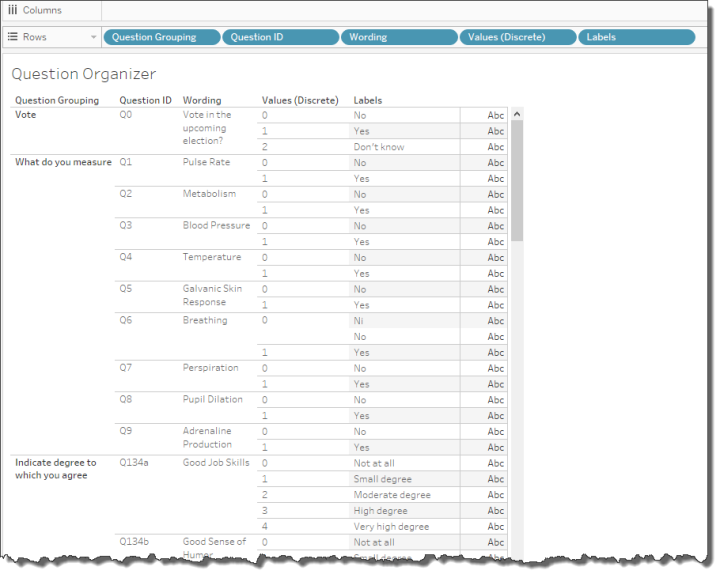
Figure 4 — Question groups, IDs, wording, and universe of possible numeric and text responses
Now that we've examined all of our questions, let's take look at the respondents who completed the survey and get a sense of who they are.
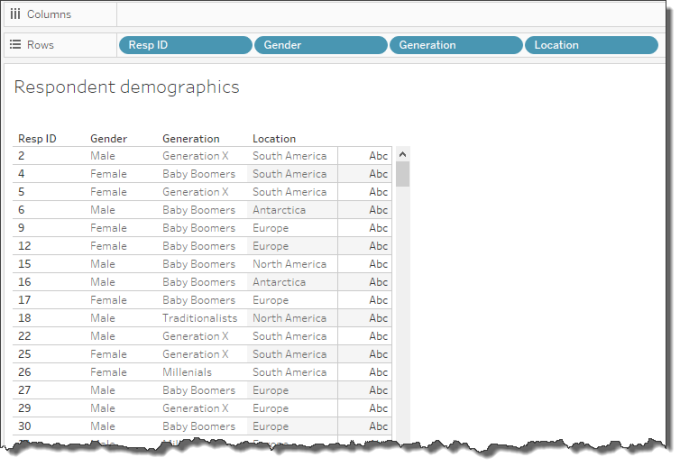
Figure 5 — The demographics for each survey respondent.
Notice that we have separate columns for Gender, Generation, and Location.
So, how can we promote the "Do you plan to vote" question (Q0) from being a collection of rows into being its own dimension / column?
Plan to vote as a separate column
The LoD expression that will do what we want is this:
The way to interpret this is
Starting at the innermost part of the calculation, in the IF statement check each record and return the [Labels] value (i.e. "Yes", "No", or "Don't Know" only if the [Question ID] is Q0, otherwise return a Null. Then, for each [Resp ID] in the data, return the maximum value of the results of the IF statements for that respondent, where MAX() will return "Yes", "No", "Don't Know" or NULL if the respondent had never answered that question.
If you are wondering why you need the MAX() function it's because you need to have some type of aggregation when using an LoD expression. Note that MAX() or MIN() will both work as they will accept text as an argument, while SUM() and AVG() will not work.
You can now drag this newly-created field, named [Plan to vote] and use it as you would use any dimension, as shown below.
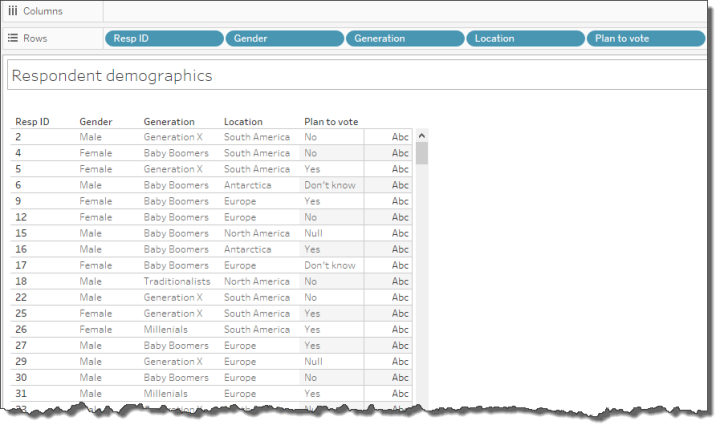
Figure 6 — "Plan to vote" as a demographic dimension.
Do note that there are some Null values as some respondents did not answer that question. You may want to alias these as "Did not respond".
Making this flexible
This technique will work for elevating any single question to behave as a dimension and if you only have a handful of question you want to treat this way you need not read on.
But suppose you have dozens of not hundreds of questions that you want to explore as dimensions? You certainly won't want to "hand chisel" hundreds of separate LoD expressions.
Instead, we should create a parameter-based solution that will allow users to select the question they want to "promote" from a drop-down menu.
You can read how to do this in Part 2.