January 3, 2018
In the first part we saw how to “hard code” the creation of a dimension from row-based survey data using a Level-of-Detail expression. In this second part we’ll see how we can turn any row-based survey data into a dimension “on the fly” using a parameter.
Where we left off
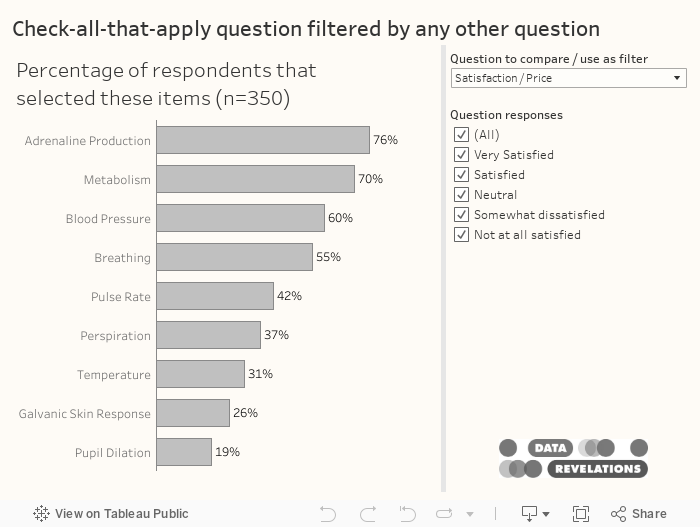
You may recall the calculation that would allow people to cut / filter by the question “do you plan to vote in the next election” was this:![]()
So, how do we take this “one-off” calculation and make it flexible?
Making a flexible, extensible solution
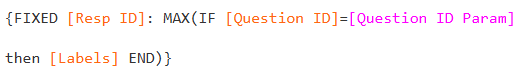
One approach is to create a parameter called [Question ID Param] and seeding it with values from the Question ID field. The resulting calculation would look like this:
The problem is that your “friendly” parameter list will look like this:
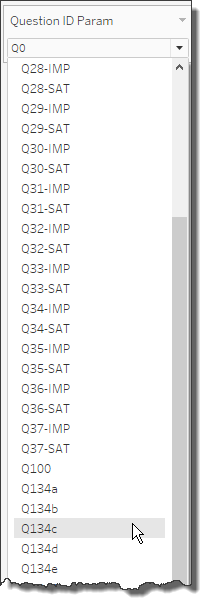
Figure 1 — Not-very-friendly question list.
Quick! What does “Q34-SAT” stand for?
Maybe we should instead populate the parameter list from the human-readable form of the Question ID, in this case the [Wording] field. Here’s what that will look like.
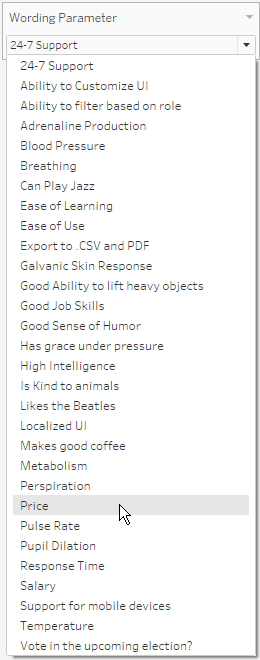
Figure 2 — Friendlier list, but still many problems.
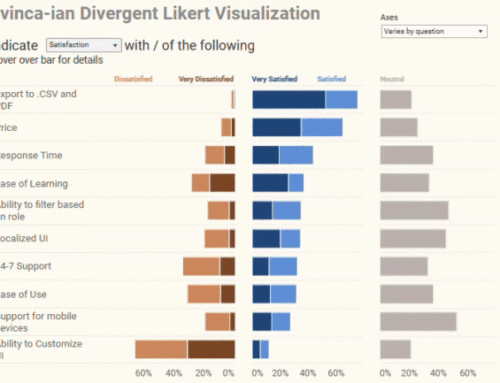
This is certainly an improvement, but there are two big problems with this. The first is that there may be Question IDs that in fact have the same wording. Indeed, if your survey delves into comparing how important a list of features is with how satisfied people are with those features, you will need for the wording to be identical. For example, “Price” could refer to “How important is this to you?” or it could refer to “How satisfied are you with this?” (See this blog post for a discussion of visualizing importance vs. satisfaction.)
The second problem is that the questions are in alphabetical order, so you have three importance / satisfactions question, followed by three check-all-that-apply questions, followed by a handful of Likert-scale questions, followed by another importance / satisfaction question that should be with the first group, etc.
Combing Grouping with Wording
Jonathan Drummey came up with a very easy way to both disambiguate the satisfaction from the importance question and group the questions in the parameter list logically. The trick is to create a new field (we’ll call it [Question Parameter List]) that concatenates the question grouping and the question wording. We will define is as follows.
[Question Grouping] + ' / ' + [Wording]
This creates a list that looks like this.
![Figure 3 -- Results of concatenating [Question Grouping] with [Wording].](https://datarevelations.com/wp-content/uploads/2018/01/08_ComboList.png)
Figure 3 — Results of concatenating [Question Grouping] with [Wording].
We’re almost done, we next need to create a new parameter, we’ll call it [Question to compare], and we’ll populate it with the members of the [Question Parameter List] field, as shown below.
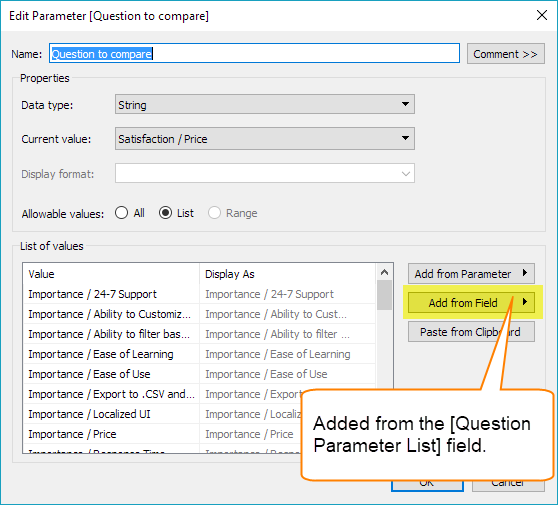
Figure 4 — Our friendly, disambiguated, logically-grouped list of questions.
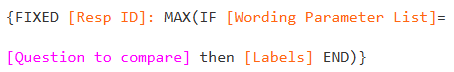
Armed with this concatenated list we can modify our hard-coded LoD expression field so that it looks like this.
Before you explore the downloadable dashboard at the end of this post I want to dissuade you from inflicting this “filter any question by any other question” functionality on your audience as you will simply be hitting them with too much flexibility. While I’m sure there are some insights to be gleaned from some of the question combinations, there are probably dozens, if not hundreds, that won’t yield anything useful. Do you really want to make your audience find where the good stuff is?
Cole Nussbaumer Knaflic presents a wonderful one-day workshop around her book, Storytelling with Data. In the workshop she states that finding good insights buried in a mound of data is like having to shuck a lot of oysters to find a pearl. Don’t show your audience all the oysters you shucked (and certainly don’t make them shuck the oysters!); just show them the pearl.
Yes, you should use this technique to find insights that go beyond cutting the data by traditional demographic questions. And if / when you find something useful, limit what you show your audience to just those filters / options that provide insight.
One last thought: if you are building a “this-has-to-be-slick” dashboard — perhaps one that is customer-facing — consider ditching the single concatenated parameter and instead building a parent / child pair of parameters using Tableau’s Javascript API. The first parameter would show the question grouping and the second would show the question in human-readable form based on what was selected from the first parameter.