Overview
Tableau 9.0 includes a built-in data prepping tool that makes reshaping survey data so it plays nicely with Tableau a much smoother experience than using the Tableau Excel add-in. While this new feature won’t replace by trusty copy of Alteryx (for reasons that I explain later in this post) there are many occasions where Tableau’s new pivot feature will be more than adequate.
In this post I will walk through using the new pivot feature along with “temporary” blending to create a solid framework for using survey data with Tableau.
Special thanks to Susan Baier for bringing this to my attention and Jonathan Drummey for showing me Tableau’s Create Primary Group feature.
So, what do we have here?
Note: if you want to follow along you can download the Excel file here.
Consider an Excel workbook that contains two sheets. The first sheet has the survey results, a snippet of which is shown here.

Figure 1 — Some raw survey data
Notice the format: one row for each survey respondent and a separate column for each question in the survey where each question is identified with a Question ID (e.g., Q0, Q1, Q2, Q134a, etc.).
Column A contains a unique ID for each survey taker, Columns B through D contain demographic information, and Column E contains a weight for each survey respondent.
The second sheet maps each Question ID to a human-readable version of the question and groups related questions into logical buckets.

Figure 2 — Helper file that maps each Question ID to the wording of the question from the survey
Note that when I first blogged about survey stuff I didn’t use a helper file but now I won’t take on a project without creating one as I don’t want to spend time aliasing hundreds of question IDs. The Grouping column also makes is much easier to select related questions and visualize them together.
The data wants to be tall and thin
Anyone who has read up on the subject know that life with survey data and Tableau is a lot easier when the data is reshaped so let’s see how to do this with Tableau 9.0.
- In Tableau, connect to the data source and the sheet that contains the data you want to reshape and visualize. This is what it looks like on my screen.
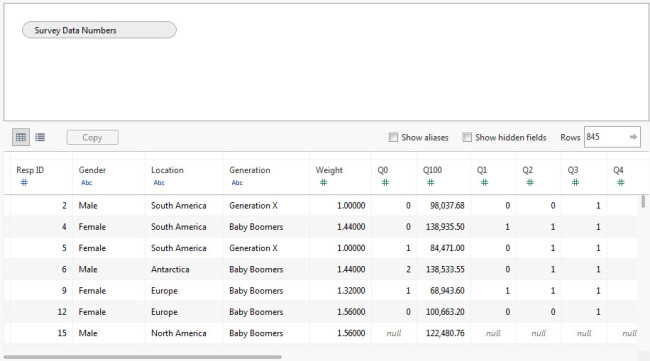
Figure 3 — Survey data prior to pivoting (reshaping)
- Select the fields you want to merge / pivot / reshape, in this case everything except the Resp ID, demographic fields, and Weight field.
- Click in any of the highlighted fields and select Pivot. Tableau will combine the 20+ fields into two fields, as shown here.
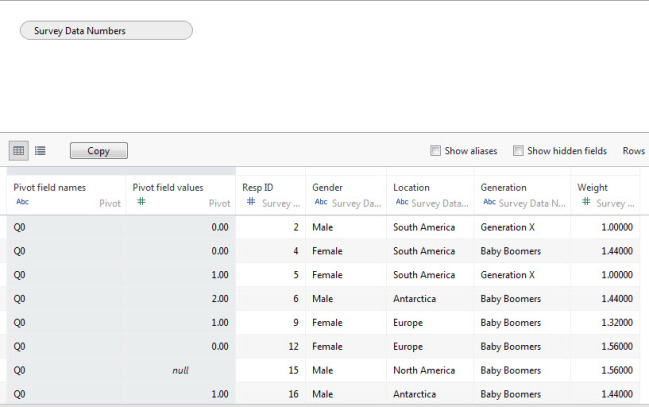
Figure 4 — Data after it has been pivoted
- Rename the first field Question ID and the second field Value.

Figure 5 – Pivoted fields renamed
- Indicate whether you want an extract (a good idea when Excel is the data source) and go to the Tableau worksheet.
- Drag Question ID onto the rows shelf. Your screen should look like this.
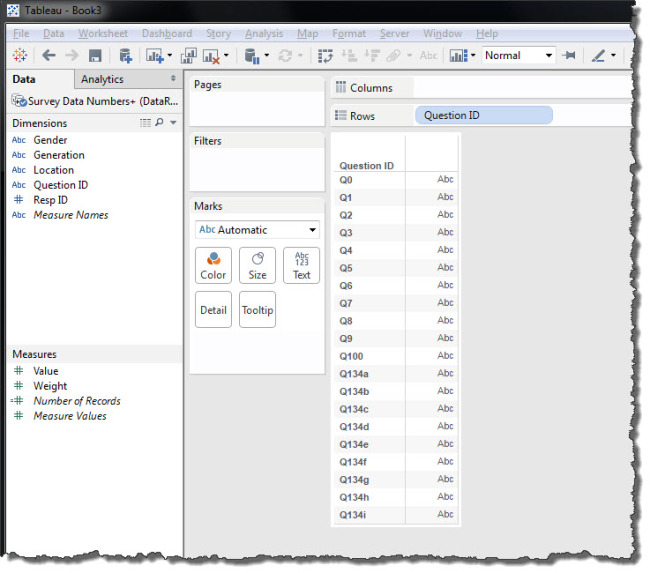
Figure 6 — Reshaped data in Tableau. Instead of 20 measures for each question we have only one measure.
Creating the temporary blend
Now we need to connect and relate the Helper file to our pivoted survey data. We will do this with a blend, but then use a very slick feature of data blending that will allow us to ditch the secondary data source. Here are the steps.
- Click the Add New Data source tool.

- Connect to the Helper File sheet from the same Excel workbook and indicate whether or not you want to create an Extract (of course you do!)
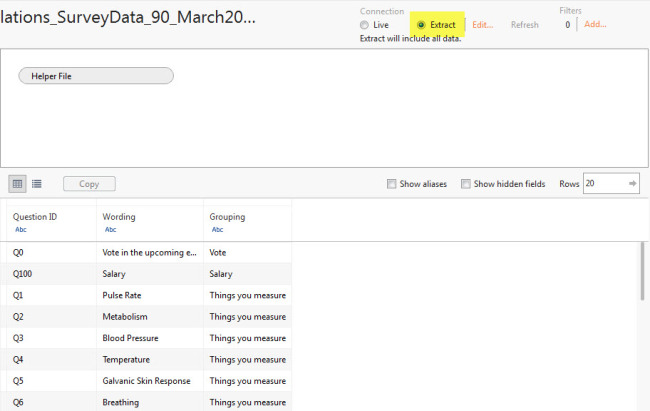
Figure 7 — The secondary data source
- Return to the Tableau worksheet.
- Drag the Grouping field to the left of Question ID on the rows shelf, and Wording to the right, as shown below. Note that you don’t *have* to do this but it’s always useful to see if the hierarchy is working correctly.
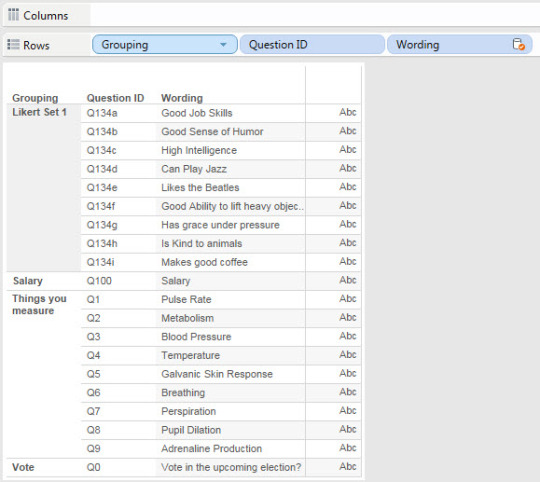
Figure 8 — Blended Data
- Right-click the Grouping pill on the Rows shelf and select Create Primary Group.
- Rename the group Grouping as shown below.
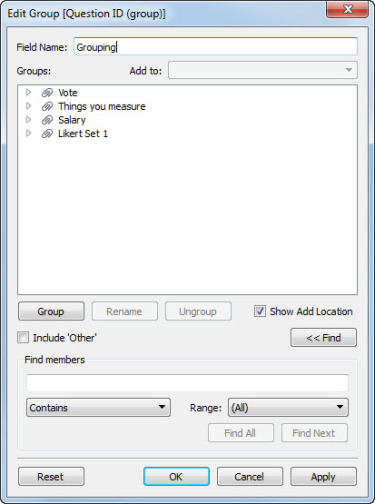
Figure 9 — Leveraging the blend to create an ad-hoc group based on Question ID fields.
- Click OK.
- Right-click the Wording pill on the Rows shelf and select Create Primary Group.
- Rename the group Wording and click OK.
- Click the primary data source (the one from which we initially selected Question ID). Notice the two groups that Tableau generated for us.

Figure 10 — Tableau-generated groups
At this point we no longer need the secondary data source as the primary source now has groups that map and alias the Question IDs. Very slick.
Seeing this in action
Now that we have the groups it’s easy for us to do some very quick analysis. For example, let’s suppose we want to see the average Likert scale score for the collection of Likert scale questions.
- Create a new worksheet.
- Drag Grouping into the Filters shelf and select the collection of questions you want to view, in this case Likert Set 1.
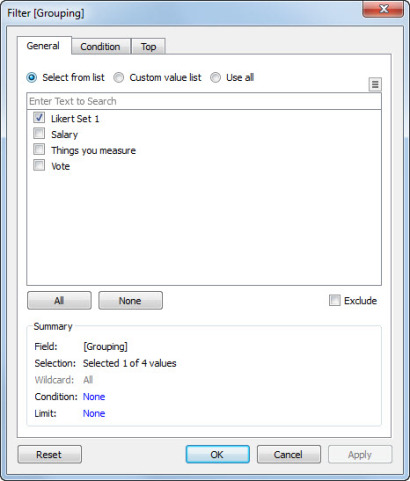
Figure 11 — The Grouping group makes is easy to indicate which sets of related questions you want to examine.
- Drag Wording to Rows.
- Right-Drag Value to Columns and select AVG(Value).
- Sort in descending order.
Isn’t this great? We didn’t have to go groping around for the right Question IDs and we didn’t have to alias anything.
So, are there any shortcomings? Is this blend approach as good as being able to join the pivoted data with the helper file?
Yes, there are shortcomings
There are several things that a join will give us that we can’t get with a blend.
You cannot refer to the group in a calculated field
You can’t refer to a group in a calculated field, so something like this won’t be available:
IF [Grouping] =”Things you Measure” then [Value] END
You need to update the group members if you add new questions
Tableau’s generation of the primary group is much like populating the members of a parameter with the members of a field. Tableau will do it when you click a button, as it were, but it won’t update the list automatically.
If you end up adding new questions to your survey or reorganizing how questions are categorized in your helper file will either need to regenerate the primary data source groups or manually edit them.
You cannot combine text results with numeric results
This is one of the major “gotchas” for me, at least for larger surveys. With most commercial survey systems you can download the data in a label format or a numeric format. For example, when downloaded as labels survey responses might look like this:
Strongly disagree
Disagree
Neutral
Agree
Strongly agree
When downloaded as numbers the same responses would look like this:
1
2
3
4
5
I find I like to have both label and numeric responses, so I pivot / reshape both sets of data and then join them together using Question ID and Response ID. Using Alteryx I can perform the join but I cannot do it with Tableau 9 and pivoted data.
Conclusion
For complex surveys where I need to do a fair amount of data cleanup and need both next and numeric values I’ll continue to use Alteryx. For shorter surveys where I don’t need to do a lot of prep work and where either labels or numeric values will suffice, Tableau 9.0’s new pivot feature suits me just fine. It’s a great addition to a great product.