Updated on September 11, 2018.
Note: Special thanks to Joe Mako who suggested this approach.
Overview
I’m fortunate that when I work with survey data that is not well-coded I can take out my trusty copy of Tableau Prep, EasyMoprh, or Alteryx Designer and get my data “just so.”
But what if you don’t have a copy of one of these data prep tools? Or what if you want to use Qualtrics’ or SurveyMonkey’s Web Data Connector and don’t have the ability to insert a data prep tool within your workflow?
In this blog post we’ll see how you can get Tableau to address the problem. Specifically, we’ll see how to work with check-all-that-apply questions where the data has been coded as 1s and blanks instead of 1s and 0s.
So, What’s Wrong with Blanks?
Consider the data snippet below that shows responses to a group of check-all-that-apply questions. This is what I consider to be badly-coded data.

Figure 1 — Check all that apply questions as they might appear in a CSV file downloaded from Qualtrics.
Now here’s how I would prefer the data to be coded.
So, why is this better?
By having 1s and 0s we can see, easily, if some respondents didn’t answer the question group at all. In the figure below, we can see that respondents 15 and 29 did not make any selection for any of the check-all-that-apply questions. More importantly, with data coded with 1s and 0s, Tableau can just filter out the Nulls and we’ll get accurate results.

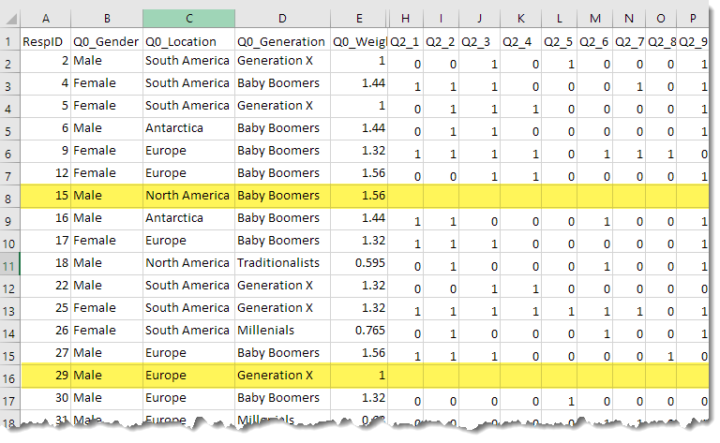
Figure 3 — Respondents that didn’t answer this question group are highlighted in yellow
So, given our constraints, how are we going to come up with a way to distinguish between a blank that means a respondent didn’t select a particular option and a blank that, when combined with the other related blanks, means the person didn’t respond to the group of questions at all?
Before going any further, note that there’s no way we’re going to deal with the data in this wide format. That is, instead of the data looking like it does in the previous example, the data will instead look like this.

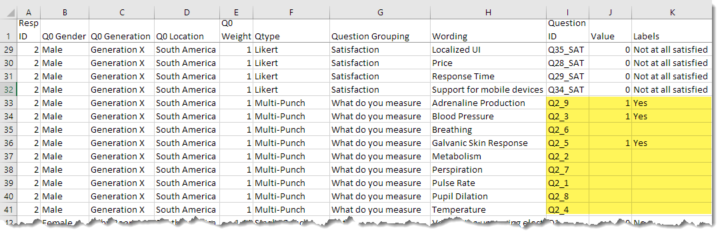
Figure 4 — A snippet of the data showing some responses for Resp ID 2. Note that we can see that this respondent selected “Yes” / “1” for Q2_9, Q2_3 and Q2_5.
If this format is foreign to you, stop reading this now and have a look at Getting Survey Data “Just So.”
So, with this tall format in mind, and the ability to easily indicate that you just want to look at a group of questions, let’s see how we can get a handle on who among the respondents selected something.
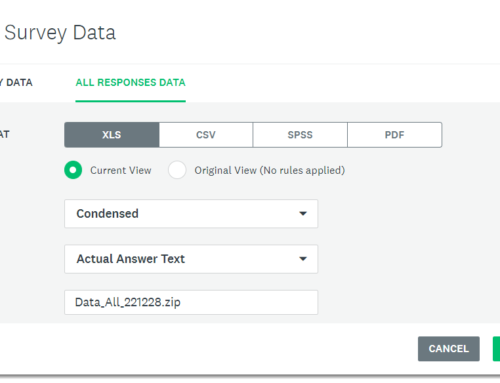
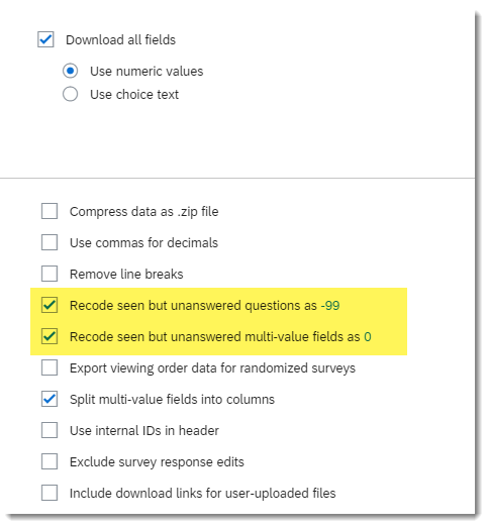
How Many Things Did Each Respondent Select?
Consider the visualization below which shows the SUM([Value)]) for each Resp ID where [Value] can be 1, 0, or blank (null). Note that we have a filter set so we only see the responses to the group of related check-all-that-apply questions.

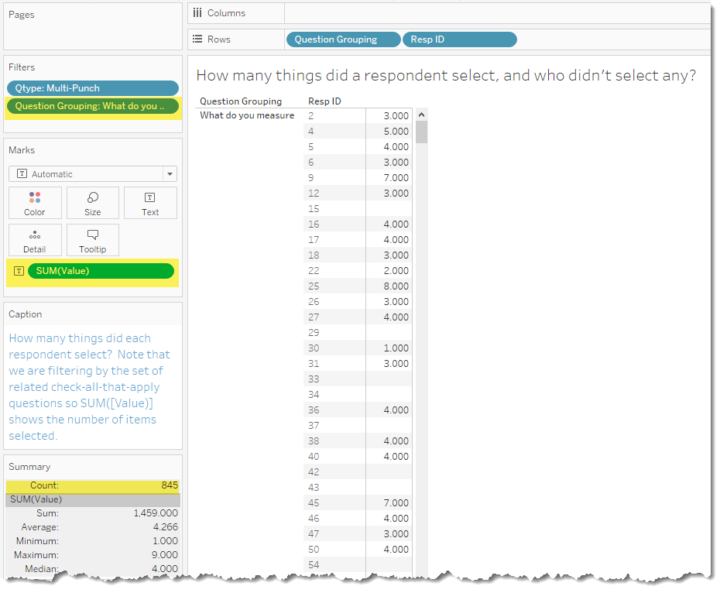
Figure 5 — For each Resp ID, show the SUM([Value) for all the check-all-that-apply questions. We can see that respondent 2 selected 3 items, respondent 4 selected 5 items, and so on. If we were to scroll down we would see that many respondents didn’t select anything, meaning they did not answer the question group. Note that 845 people participated in this survey (see that last item highlighted in yellow).

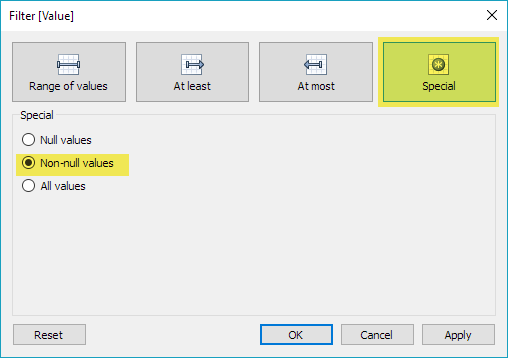
Figure 6 — Adding a filter so we don’t see null responses.
Note that when we do this we see that only 342 responded to this group of questions, as shown below.

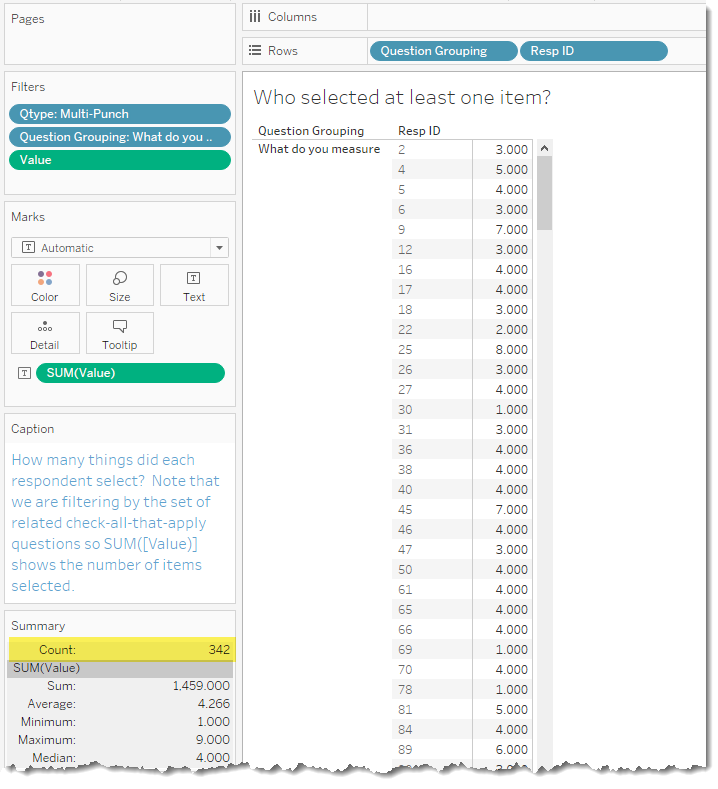
Figure 7 — Adding a filter removes the respondents that didn’t select at least one item. We could also have placed SUM([Value)) on the Filters shelf and indicated that the value should be at least 1.
So what are we going to do?
Level-of-Detail Expressions to the Rescue
Anytime you think “I need Tableau to consider some dimensions when making a calculation, but those dimensions can’t be in the visualization” a giant alarm bell should go off in your head — this is precisely the use case for a LoD expression!
Here’s the LoD calc, that when placed on the Filters shelf, will do the trick:

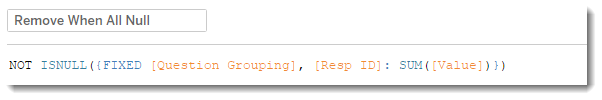
Figure 8 — LoD calc that allows us to exclude folks that skipped answering a question group.
A translation into English would be:
Even though [Question Grouping] and [Resp ID] may not be on the viz detail, take that combination of these two fields and find the SUM([Value]). Then find only the Null values from this and exclude them by setting the filter to True.
Note that we are using FIXED instead of INCLUDE as the former will automatically create a dimension and will work no matter what other filter settings may be in place.
Putting this Altogether
First, we need to create a calculation that gives us the percentage of people that selected an option from the group of check-all-that-apply questions. For this instance, the following calculation will work well.

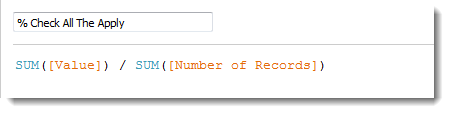
Figure 9 — How to determine the percentage of people that selected an option.
A quick translation into English would be:
Add up everybody that answered “1” (meaning they selected an option) and divide by the number of people that answered the question.
Let’s see if this works. Consider the visualization shown below.

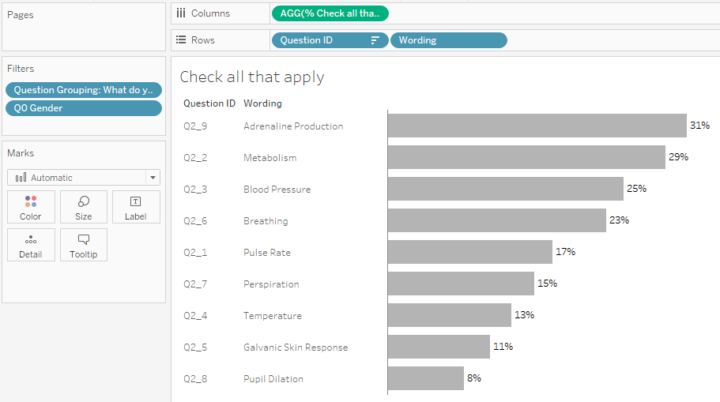
Figure 10 — First attempt at showing the percentage of respondents that selected an option. This is NOT showing the correct percentage.
Does this pass the “smell” test? These percentages seem very low for a check-all-that-apply question that had nine things people could select. Indeed, if we place SUM([Number of Records]) as a discrete measure on the rows shelf we see that Tableau believes 845 people responded to the question, but we know only 342 responded.

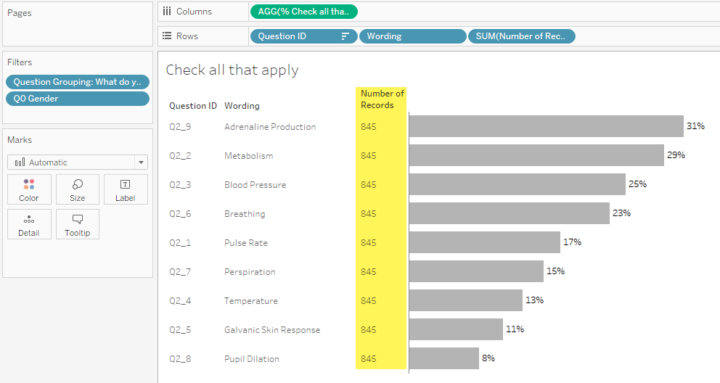
Figure 11 — Without a filter Tableau believes 845 people responded to this group of questions.
We need to put our LoD calc on the Filters shelf and set it to True.

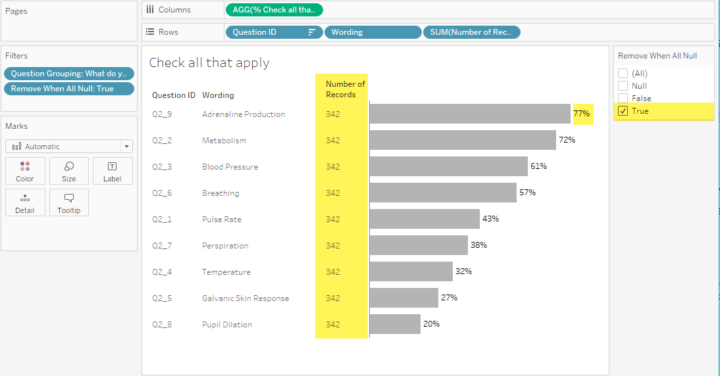
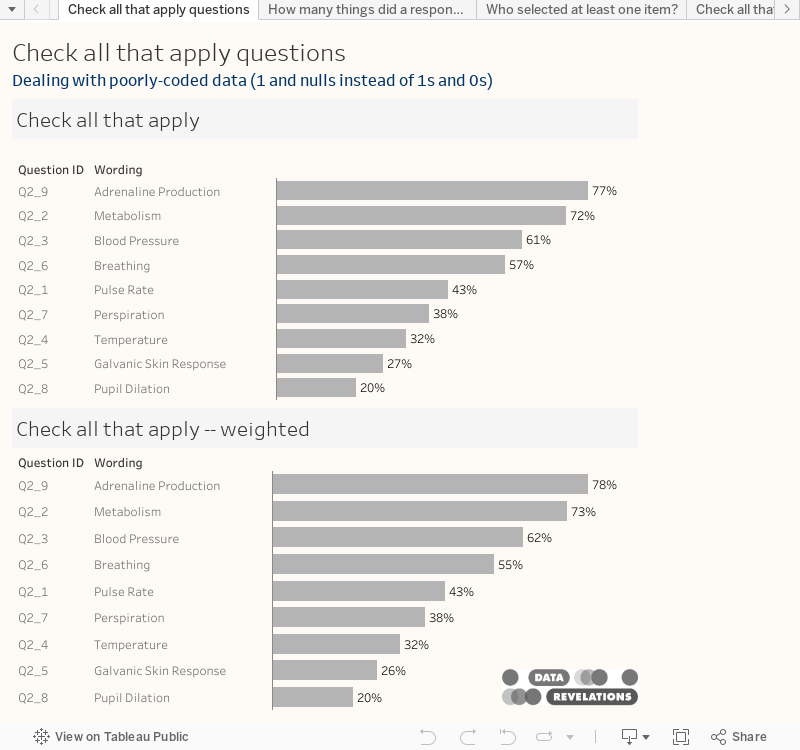
Figure 12— Removing “All of these are Null” from the respondent pool gives us the correct count of 342 and the correct percentage (77% instead of 31% for the first item.)
Conclusion
How check-all-that-apply questions are coded is a problem with many survey tools including Qualtrics and Survey Gizmo. If you have a good data preparation tools like Tableau Prep, EasyMorph, and Alteryx you can fix the problem, but if you don’t have such a tool or don’t want to insert something into your workflow then you can get Tableau to address the problem with a Level-of-Detail expression.
Awesome, Steve!
Here’s an alternative that I’ve used, for these purposes I’d call this the “Usable Value” calculation:
IF {FIXED [Question Prefix], [Resp ID] : MAX([Value])} =1 THEN IFNULL([Value],0]) ELSE [Value] END
This pads in 0s for the questions where someone actually responded. Then the calculation for the % Check All That Apply is:
SUM([Usable Value])/COUNT([Usable Value])
And I don’t have to remember to put anything on the Filters Shelf to get an accurate result. For me that’s a big plus because I’ve done the thinking in a data preparation step (to create the Usable Value) and then in building views I can be in drag & drop mode.
Jonathan
Jonathan,
Very cool. Question (and I don’t have time to pursue this right now): how would you modify this to address weighted data? For example, let’s suppose each respondent has a weight measure associated with him / her. A calc to give you the weighted percentage would look something like this:
SUM(IF [Value]=1 THEN[Weight] ELSE 0 END) / SUM([Weight])
Steve
How about SUM(IF [Usable Value] = 1 THEN [Weight] ELSE 0 END) / SUM([Weight])?
Jonathan,
Is this going to work? I think the denominator will be too large as it will include all respondents. In the other version you are counting the number of usable responses; here you are not.
Steve
You’re right, I’d forgotten about that complexity. Here’s a revised formula that checks both the numerator and denominator by effectively embedding the filter in each:
SUM(IF [Usable Value] = 1 THEN [Weight] ELSE 0 END) / SUM(IF NOT ISNULL([Usable Value]) THEN [Weight] END)
Though it’s a bit more work to set up, one reason why I use this kind of formula is that by not using a pill on the Filters Shelf I still have access to all the data. For example in this view I could have a measure like COUNTD(IF ISNULL({FIXED [Question Prefix], [Resp ID] : MAX([Value])}) THEN [Resp ID] END) that counts the number of people who had no responses to a given question.
Jonathan
Oooh, this looks good.
I think I would still reach for the filter approach, but glad to have this in my quiver as well. Most of the time I want to see the number of people that did respond, not that did not. I already know the overall N count for the survey itself.
Thanks as always for piping in.
Steve
Steve… thanks again..you are my Tableau Super Hero!
Sometimes I think you hear me everyday. This is like the third time I am working on something and the day after you post something that is exactly related to what I am doing.
I was trying to come up with a calculation similar to your LOD and what help me figure it out was the following comment “Anytime you think “I need Tableau to consider some dimensions when making a calculation, but those dimensions can’t be in the visualization” a giant alarm bell should go off in your head — this is precisely the use case for a LoD calculation!”
Thanks Again!!
Hi Steve,
Can I use LoD for responses to this question:
Q1 – Which words describe how you currently feel about company A? Select all that apply.
Happy (1)
Satisfied (2)
Valued (3)
Unhappy (4)
Frustrated (5)
Here’s what the respondent data looks like:
UserID #1 – Happy
UserID #2 – Happy, Valued
UserID #3 – Valued, Happy
UsedID #4 – Frustrated, Valued
Do you have any examples in the blog or the Data Revelations Student Guide that can help guide me on how to clean and format the cells that contain multiple responses? Can I use the LoD calculation to clean up these responses.
Currently, my solution is to recode the phrases: Happy = 1, Happy,Valued = 2, etc.
Thanks!
Tha Vin,
Sorry for the late response. This looks like how Google Forms encodes data: a single column with semi-colon delimited data. You can definitely convert this “one column with values separated by commas or semi-colons” into data that has a column for each response. I’ve done this using Tableau Prep and it is not difficult. And I will blog about it.
Steve
Hello, Steve!
Huge thanks for your posts & the included tips! they are super helpful, especially for a Tableau novice, like me.
I am working with a dataset collected with SurveyMonkey, with one check-all-that-apply type question, where respondents were required to select workshop topics that they would be interested in (out of 7 options)
My problem is that in the xls export generated by SurveyMonkey, responses are coded on a numerical scale from 1 to 7 (no of response options) – e.g. if someone checked the last two workshops from the list, they appear as 6&7 in numerical format.
Any ideea on how could I work with this to get 0 and 1s instead?
Thank you in advance!
George,
So SurveyMonkey is placing 1, 2, 3…7s (and blanks) in the cells, but there are separate columns for each option, yes? That is, you don’t a single cell that has all the values separated by a semicolon or a comma. (There’s a way to deal with that, too. Read the most recent post about using Google Forms for survey data).
If I understand your situation correctly there are two ways to handle this. The first is to use a data preparation tool and convert the 1, 2, 3… 7s to 1s.
The second is to change the formula for a check all that apply question. So, instead of this:
SUM([Value]) / SUM([Number of Records])
try
SUM(IF [Value] >=1 then 1 else 0) / SUM([Number of Records])
Steve
Steve- I’ve used your blog a lot recently but still haven’t been able to figure out a pretty basic issue. The surveys I am working with are from Survey Gizmo. For check-all questions, they are never formatted “just so”. The way I have handled this is to go back in and recode them manually in Excel. There doesn’t seem to be an option to download data in text vs number form from Survey Gizmo. Do you have any advice for formatting data from Survey Gizmo? I want to use Tableau with the data we are gathering but the formatting (as I understand my choices now) seems to time intensive.
Michael,
I don’t think I’ve used Survey Gizmo, but it would surprise me if it just allowed download in one format.
Are the check-all questions coded as “Yes” and “No”? “Yes” and blanks? If the former you can just have a calc in tableau that give you the values as in
if [ResponsefromSureyGizmo]=”Yes” then 1
elseif [ResponsefromSurveyGizmo”=”No” then 0
else NULL
end
If you are getting “yes” and blanks then you’ll need to look at my posts about dealing with survey tools that don’t code check-all-that-apply quesitons properly.
Steve
I contacted Survey Gizmo support regarding downloading the data in number format and they weren’t able to help. From what I understand, it can only be downloaded in one report form and that is partly based upon how it is coded by the user
For Check All questions, the output is giving me the column header as “Response Name:Question” and then below it whatever the response was coded as (e.g. 1, 2,3– usually a number but depending on how it was programmed it could be coded as text.
Here is the format that check-all questions typically come out as:
Column 1 Column 2
Price: What is most important about buying product? Other:What is most important about buying product?
1 7
1 7
1
7
1
1
Michael,
So there is a separate column for each check-all question, yes?
If so, please see my response to George on January 6 of this year as it should address your needs.
(if you are just one column with either comma or semi-colon delimited responses, see my blog post about using Google forms.)
Steve
Ah! Okay. Will do. Thank you Steve.
Hi Steve!
I’m using Qualtrics survey data, and it’s possible to download the data to show a number for the options that were not selected, however, it’s coded as “-99” and not “0”. How do you deal with a “1” and “-99” vs “1” and “0”?
Thank you!
Ann,
Does the -99 mean the did not select, or does it mean they skipped the question completely? If the former you can try something like this:
SUM(
IF [Value]=1 then 1 else 0 END)/
SUM([Number of Records])
Steve