November 25, 2017
Special thanks to Jeffrey Shaffer, Andy Cotgreave, and Rody Zakovich for feedback that helped improve the dashboard that appears at the end of this post.
Overview
It seems I’m not the only person who has been thinking about stacked bar charts (see posts from Cole Nussbaumer Knaflic, Jonathan Schwabish, and Andy Cotgreave.)
My problem with these charts, and their first cousin, the area chart, is that the many people who design them don’t understand the possible pitfalls and end up creating charts that are attractive but that don’t convey a lot of useful information.
In this blog post we’ll see examples of where stacked bar and area charts work, where they fail, and what you can do to add some functionality to your dashboards so that if you do use stacked bar and area charts they will work better.
The people who market data viz tools love these charts
Some of the chief culprits include the data visualization vendors themselves who sometimes fashion “screaming cat” visualizations like these in their marketing materials and promotions.
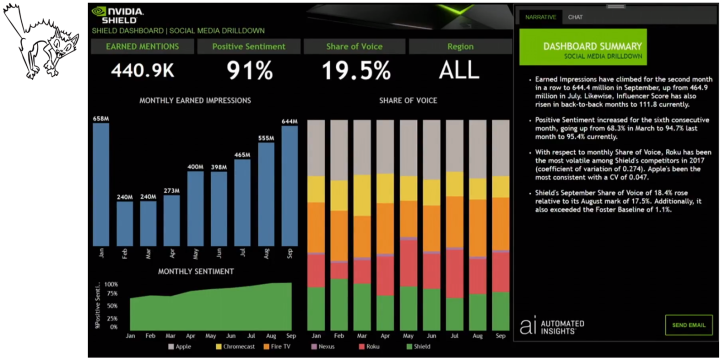
Figure 1 — Sample dashboard Tableau uses to showcase its extensions API.
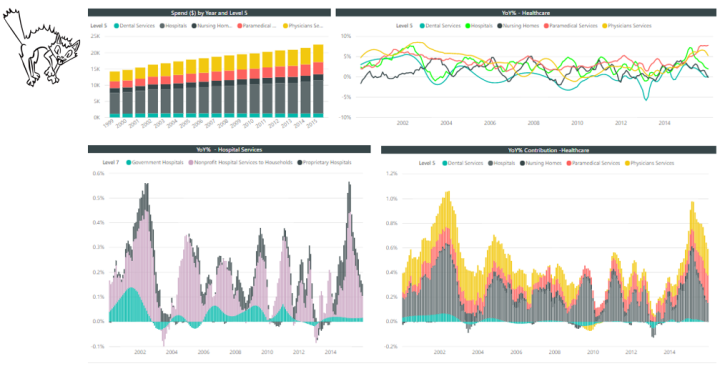
Figure 2 — Microsoft PowerBI dashboard.
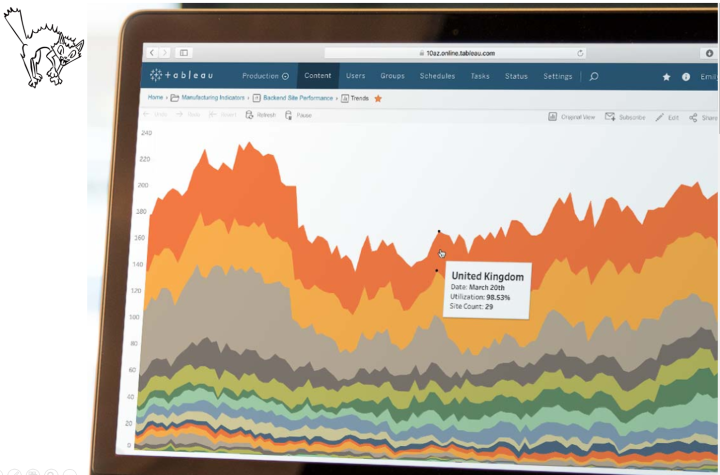
Figure 3 — Area chart from Tableau’s home page
I’ll admit the last one looks particularly cool, but do you have any inkling what it’s trying to show you?
Before we get into exactly what’s wrong with the charts (and how to fix them) let’s look at a couple of examples that work very well.
Some good examples
Here’s an example from The Big Book of Dashboards’ Complaints dashboard.
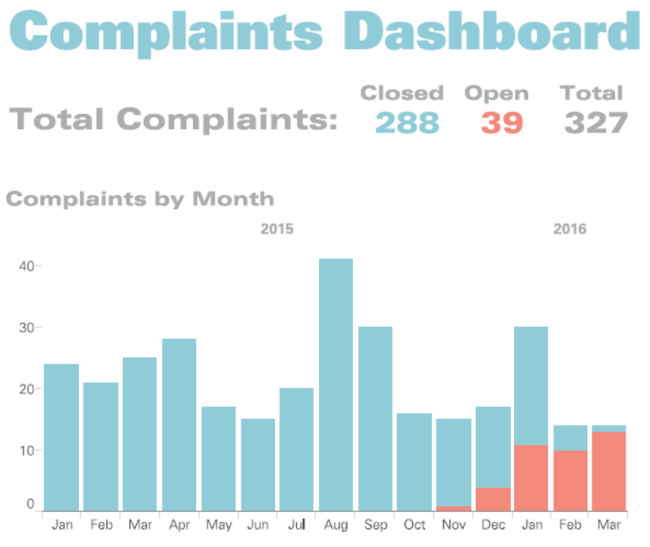
Figure 4 — A portion of the Complaints Dashboard showing open, closed, and overall complaints (Dashboard by Jeffrey Shaffer).
With this chart it’s very easy for me to see the total number of complaints (overall length of blue bars plus red bars) as well as compare the number of open complaints (red bars) because there are only two colors and the items I want to compare are open complaints (red) and total complaints (red plus blue), both of which have a common baseline.
Another example comes from Matt Chambers’ Mayweather vs. McGregor fight analysis dashboard.
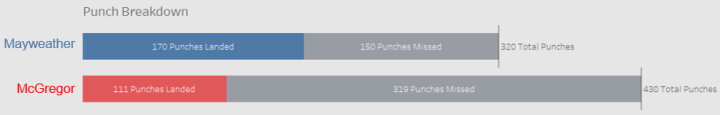
Figure 5 — Stacked bar chart comparing overall punches and punches that landed between Mayweather and McGregor
You should check out the complete dashboard, but this stacked bar chart gets to the heart of why Mayweather won the fight: McGregor exerted more effort in launching 430 punches vs. Mayweather’s 320, but far fewer of McGregor’s punches landed (111 to 170).
As you consider why this chart is so effective notice that we only care about two things — the punches that landed and the total number of punches.
So, why do I like these two examples, but cite the earlier dashboards as “screaming cats”? It has to do with how many segments there are, and which segment is along the baseline.
Let’s explore a bit.
Understanding the strengths and weaknesses of stacked bar charts
Consider the chart shown below.

Figure 6 — Typical stacked bar chart. We can make accurate comparisons of overall and of the first category (Central), but nothing else.
I can see that Phones has more sales overall (1), that Chairs is the biggest seller in the Central region (2) and the Bookcases is the lowest seller in the Central region (3). If that’s all that is important then we may be all done here (although it is hard to see that Bookcases is in fact less wide than Machines… more on that in a moment.)
But suppose I want to know what were the three lowest selling categories in the Central region, or if I wanted to easily compare sales in the East or West? In these cases this visualization isn’t much help and *that’s* the biggest problem with stacked bar and area charts: You can only accurately compare overall values and the one region that hugs the baseline.
Adding functionality — sorting and focus
Let’s address the “what were the three lowest sellers in the Central region?” question first. One way to do this would be to have a widget on your dashboard that allows you to sort by both total sales and by sales for a particular region. Here’s what the sort would look like for the Central region.
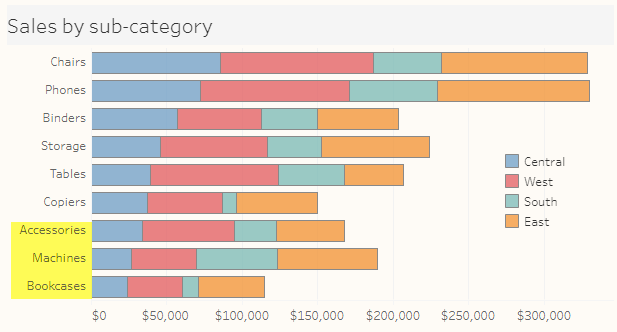
Figure 7 — Bars sorted by Central region. Now it’s easy to see which where the top and bottom sellers in that region.
Ah, now we can easily answer the question “what were the bottom three sellers in the Central region?” They are Accessories, Machines, and Bookcases.
This is great if all you care about is the Central region, but suppose you wanted co compare sales in the South? With the way the chart is configured above this is very difficult, but if you add a “widget” that allows your audience to select a region to focus on, the chart can easily answer the question.
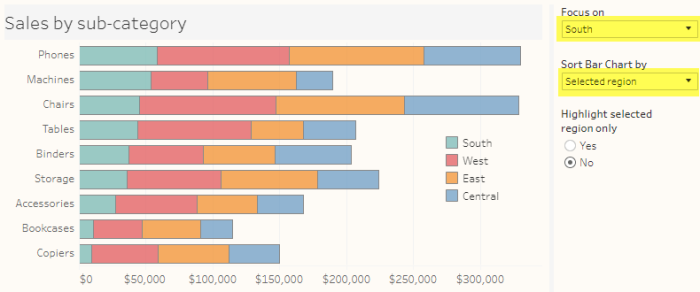
Figure 8 — Adding some functionality to the visualization so the audience can move a selected region to the baseline and sort by that region.
The “Focus on” parameter allows the user to select which region gets placed along the baseline and the “Sort Bar Cart by” parameter allows the user to sort either by the Selected region or by overall.
But, if what we’re interested in is showing how one region compares with itself and overall, why bother to have the other regions as different colored bars? That is, why not make the two things we care about — overall and the region in question — stand out more?
Highlighting the selected region
My fellow author Jeff Shaffer suggested I add this functionality to the visualization and I think it’s a terrific addition. Let’s see how much easier it is to focus on the two main questions (overall and the Selected region) when we mute the colors that aren’t stacked along the baseline.
Here’s the results when we sort by the selected region.
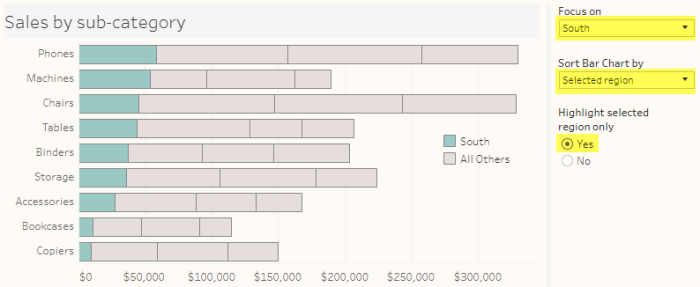
Figure 9 — Stacked bar chart with muted colors sorted by Selected region.
And here are the results when we sort by overall sales.
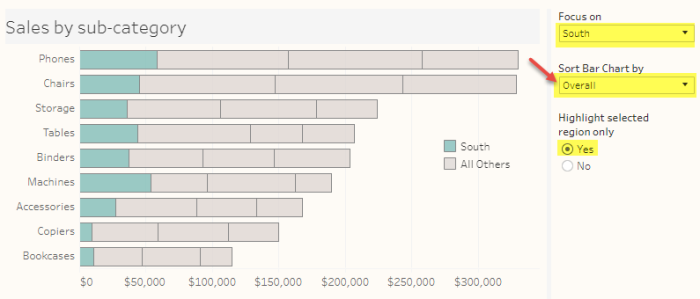
Figure 10 — Stacked bar chart with muted colors sorted by overall sales.
What about Area charts?
You’ll need to address the same issues with area charts as you can only make accurate comparisons for totals and for segments that hug the baseline, as shown below.
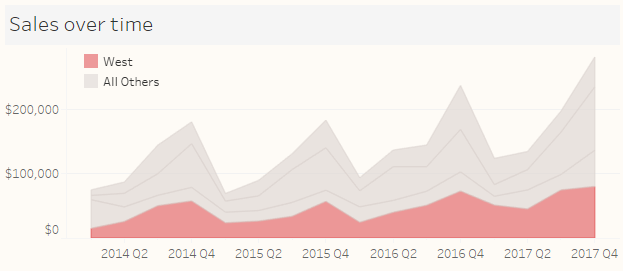
Figure 11 — Area chart showing sales over time. Note that we can compare overall sales and sales in the West as there is common baseline.
Note that because we are not including the product sub-categories the sorting feature is not needed.
100% stacked bar charts
Whereas the regular stacked bar chart allows you to make accurate comparisons of overall sales and one region at a time, a 100% stacked bar chart will allow you to accurately compare the two outer regions, as we can see below.

Figure 12 — 100% stacked bar chart. We can compare the outer regions (Central and West) because there is a common baseline
Buy we can’t accurately compare the inner regions:
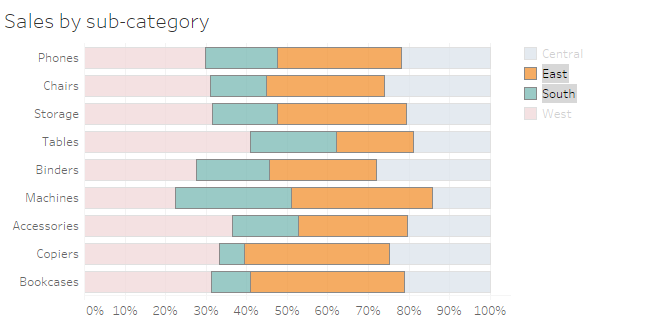
Figure 13 — 100% stacked bar chart. We cannot compare the inner regions (East and South) because the elements are floating; there isn’t a common baseline.
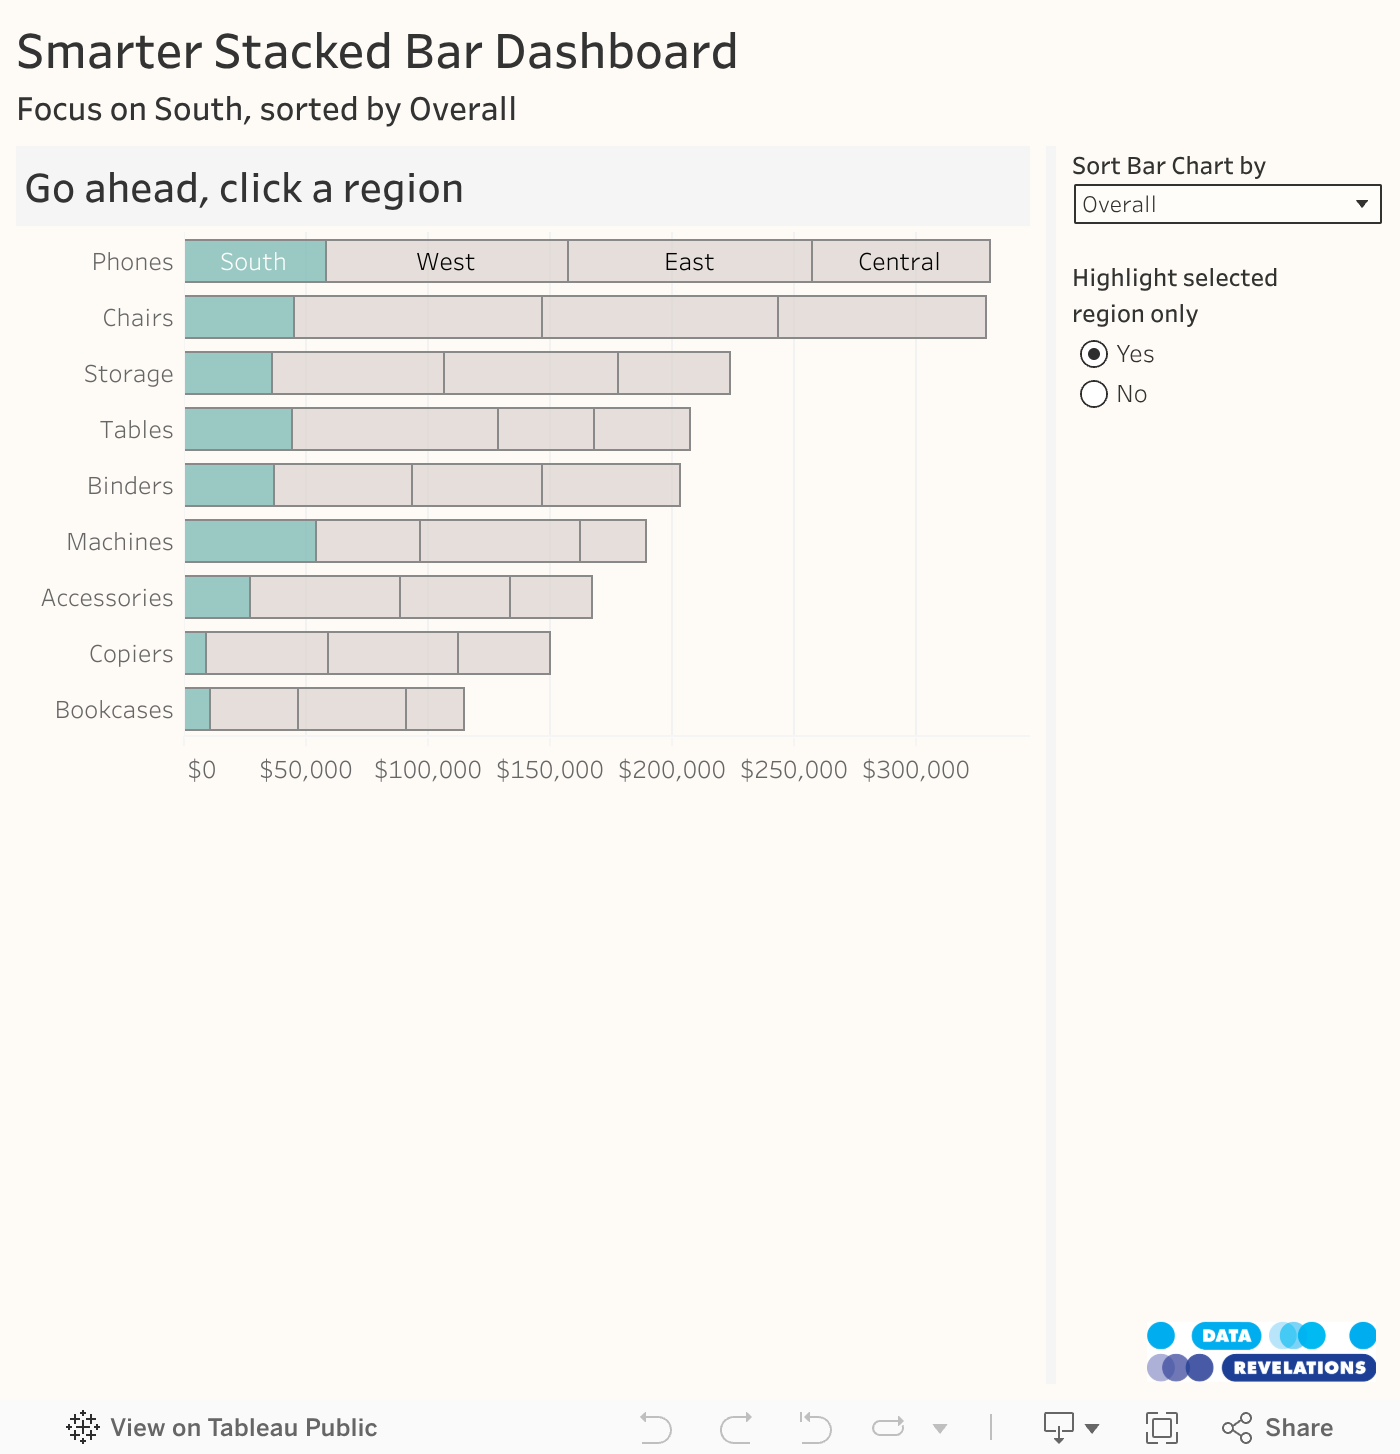
Give the dashboard a try
The dashboard below allows you to explore the functionality discussed in this post. Please note that I’m not suggesting you should include all the widgets in the dashboard. Indeed, maybe this is something you use on our own to help curate interesting findings in your data that you then highlight in a presentation or using Storypoints.
As for how to build all this functionality into Tableau, if you download and the workbook and look under the hood you’ll see there’s nothing terribly complicated going on (indeed, there isn’t one LOD calc). That said, my solution is not very robust — it’s hard-coded to only show the four known regions that are currently in the data set. I’m sure with a bit more effort one could fashion something extensible but for this blog post I wanted to prototype the functionality, not craft a robust solution.
Parting thoughts: Do make sure to check out this post where Rody Zakovich applies a different approach to looking at overall and segmented sales for individual customers.
UPDATE: I have an updated approach that doesn’t require a color legend and allows you to change the focus by clicking a bar segment.