May 2, 2018
Note: A sincere “thank you” to Arthur Gyldenege from Tableau who walked me through how to apply the technique described below.
Don’t have Tableau Prep? You can download it here.
Want the packaged Tableau Prep Flow explored in this post? Click here to download it.
Overview
As I’ve written previously, if you’re dealing with check-all-that-apply questions (a.k.a., multi-select questions) you’re going to have a much easier time in Tableau if the responses are recorded as 1s and 0s instead of 1s and blanks (nulls) as there won’t be an easy way to tell the difference between a respondent not selecting an item and a respondent who skipped the question completely.
This means you want to see data that looks like this:
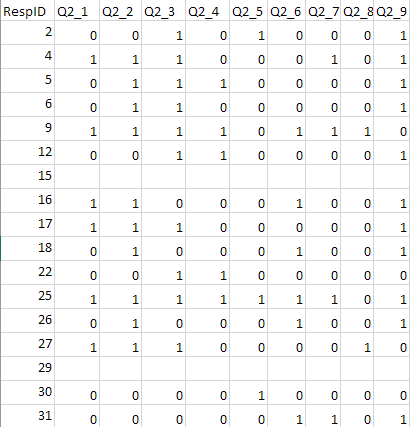
Figure 1 — A well-coded check-all-that-apply question. Notice how easy it is to see that respondents 15 and 29 did not answer this question.
And not like this:
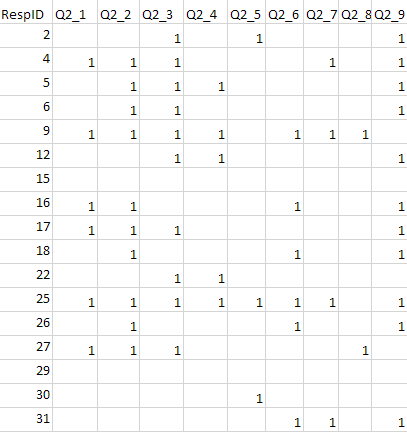
Figure 2 — A poorly-coded check-all-that-apply question.
It turns out that not only is replacing the blanks with zeros easy with Tableau Prep, we’ll also get a bonus: a new calculated field that will tell us how many people selected one item, two items, three items, and so on.
We’ll see how to fix this by modifying the same flow we explored in Getting your survey data “just so” using Tableau Prep.
Branching Out
Here’s a version of the same flow we put together for the “just so” blog post, but this time it’s connected to data that doesn’t encode check-all-that-apply questions correctly.
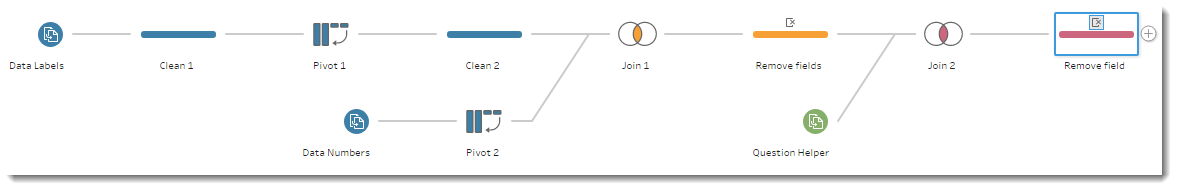
Figure 3 — The flow from the Tableau Prep “just so” blog post, but using poorly-coded data. Note also that the step to remove the nulls has been modified as we need to fix some of the nulls before we remove them.
Let’s create a new branch to the flow that focuses only on the check-all-that-apply questions. We do this by clicking the plus sign right next to the Join 2 box and adding a Clean Step. (In older versions of Tableau Prep there was an Add Branch option. Note that there are several places where a plus sign is available for adding a Clean step. Selecting the plus sign right next to the item will add the branch.)
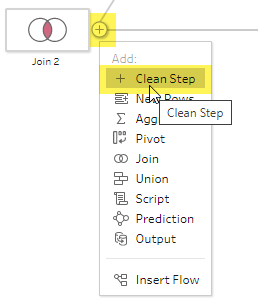
Figure 4 — Adding a branch.
Here’s what the resulting flow looks like.
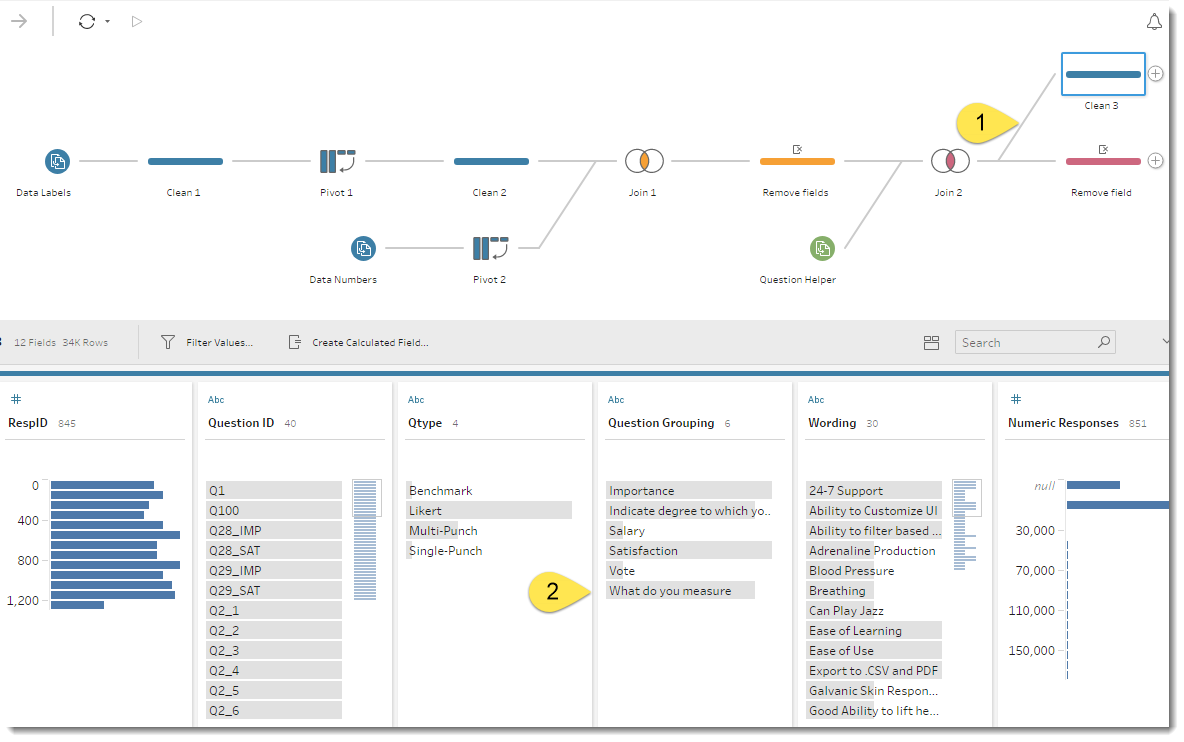
Figure 5 — Branch added (1) and highlighting the Question Grouping element that we need to address (2).
Since we only want to address responses to the “What do you measure” questions, we can right-click this in the profile pane and select Keep Only.
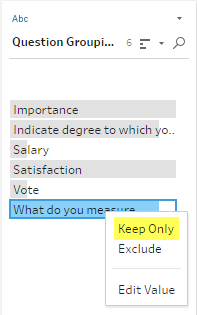
Figure 6 — Applying a filter so we only look at the check-all-that-apply questions in this branch of the flow.
Adding up all the 1s
We’ll now add an aggregation that will take the sum of the Numeric Values for each respondent for the nine possible check-all-that-apply questions. The maximum value will be 9, meaning a person selected all nine things. On the other end we’ll have null meaning a respondent didn’t select anything.
To add the aggregation, we’ll select the Plus sign next to the just-created “Clean 3” step and select Add Aggregate.
We now need to drag RespID into the Grouped Fields area and Numeric Responses into the Aggregated Fields area, as shown below.
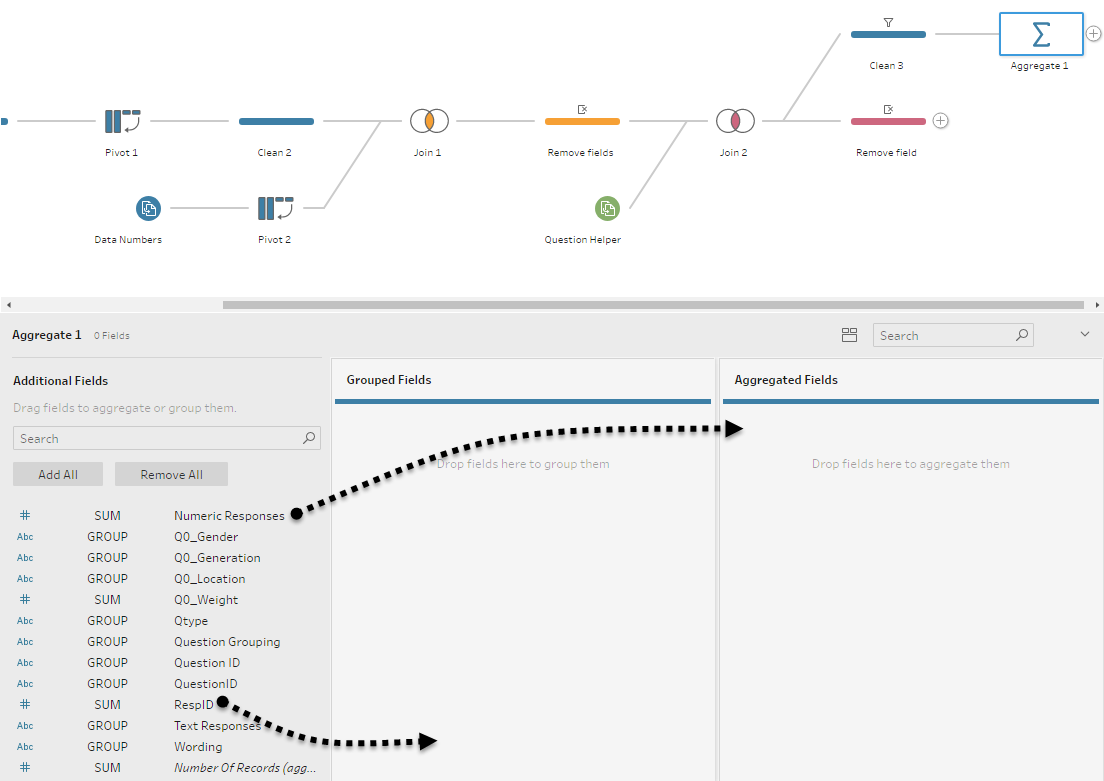
Figure 7 — Indicating which field to aggregate and how to group the aggregation. By default, Tableau Prep will apply a SUM.
When we examine the result, we can see that 503 people didn’t answer the question at all.
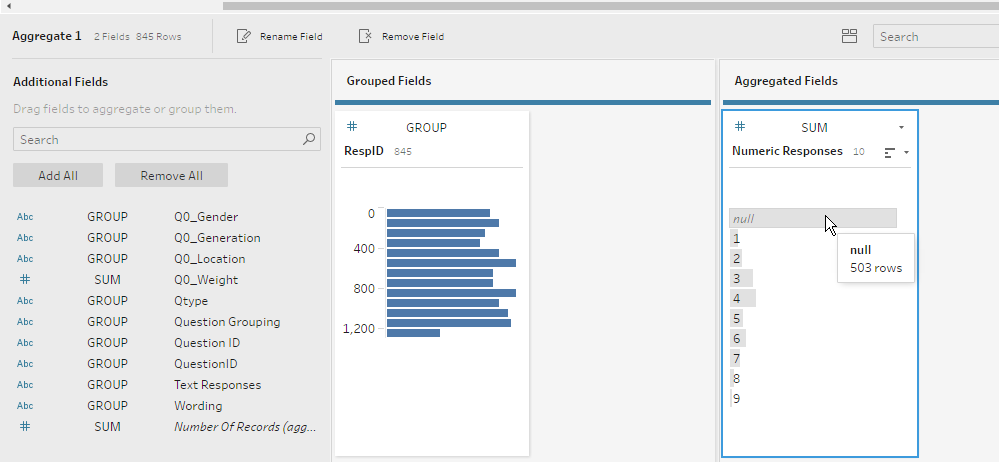
Figure 8 — Results of adding up all the 1s and blanks for each respondent. 503 people didn’t answer the question at all.
So now we know how many people didn’t check even one response. We also know how many selected one item, two items, etc. This knowledge may prove very useful down the road, so let’s give this aggregated result — which will become a new field in our database — a useful name.
We can do this by right-clicking Numeric Responses and selecting Rename Field.
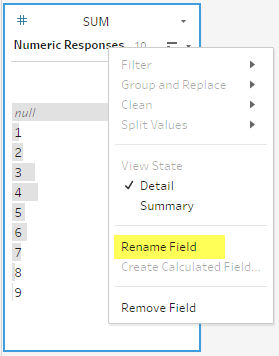
Figure 9 — Renaming the result of the aggregation.
Note: in the packaged flow the field has been renamed HowManyChecked. Note also that we’ve not done anything to turn the blanks into zeros; we’ve just created a useful calculated field.
Merging the aggregated data back into the main flow
We’ll now merge the aggregated data into the main flow by dragging the aggregation step to the right of the last step in the flow and selecting New Join, as shown here.
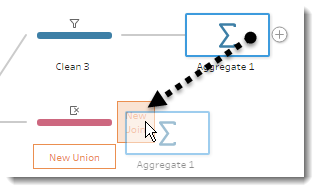
Figure 10 — Joining the aggregated data with the main flow.
Tableau knows to join the two data sources (the main branch and the just-created sub-branch) on RespID).
Here’s the merged data showing with our shiny new field, HowManyChecked.
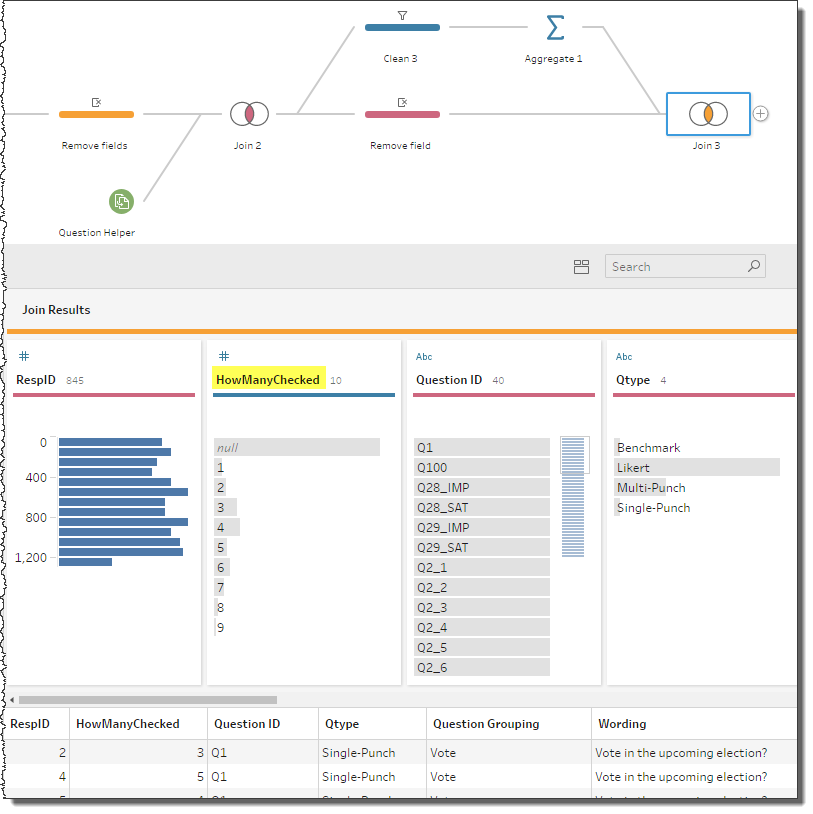
Figure 11 — Results of merging the aggregated branch with the main branch.
Replacing the blanks with zeros (for only the blanks that should be replaced with zeros)
We’ll create a “new” field that addresses the nulls problem by adding a new step and then selecting Create Calculated Field from the header in the profile pane.
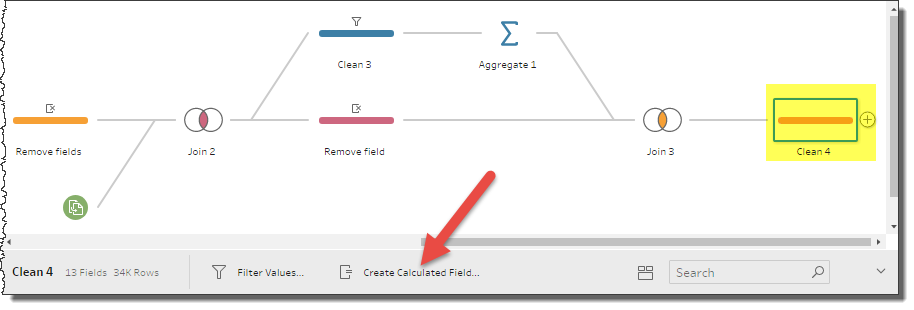
Figure 12 — Getting ready to add a calculated field.
The “new” calculated field will be called [Numeric Responses]. Yes, we already have a field by that name. In creating this field we are in fact just modifying the existing field.
Here’s the calculation that will do our bidding:
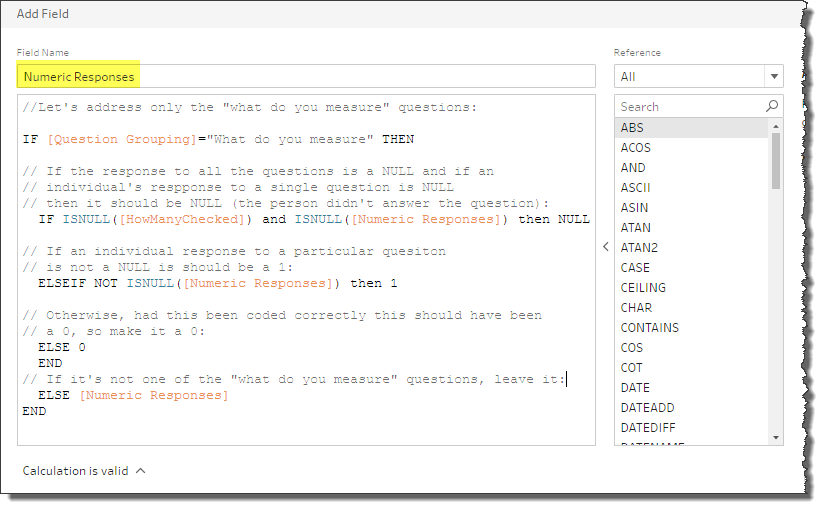
Figure 13 — Changing the contents of [Numeric Responses} by creating a “new” field by the same name that references the current values of [Numeric Responses].
Translating this “Tableau-ese” into English:
Are we looking at a check-all-that-apply question?
If yes, then If all nine options are blank (meaning that when you add them all together you get a null and each individual response is a Null) then leave it as Null.
If, however, one of the responses is not null, that item was selected, and it should have a value of 1.
If they are not all blank and the value isn’t 1, then make that null item a 0.
And if we’re not looking at check-all-that-apply question, leave everything alone.
Removing the Nulls
Now that we’ve converted the “I responded to this question” nulls to zeroes, we can remove all the nulls from our data.
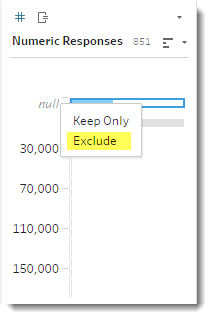
Figure 14 — Removing the nulls.
Indeed, if we inspect one of the check-all-that-apply question we can see that there were a total of 342 responses (845 survey takers, minus the 503 that didn’t answer the question) and that the Numeric Responses are all 1s or 0s.
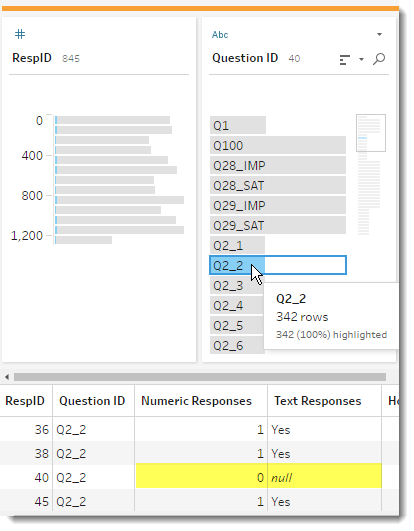
Figure 15 — Inspecting one of the check-all-that-apply questions.
If you’re wondering about the Text Responses, yes, we could convert the nulls to yesses, but we don’t need the Text Responses at all to compute a check-all-that-apply percent, so there’s little harm in leaving it as is.
Suppose you really want to keep those null values?
I tend to trim the data as much as possible, but if you want to keep the nulls you can do so, just make sure to apply a filter that removes them from inside Tableau.
But you still need to convert the nulls that should be zeros into zeros.
Conclusion
We saw in a related post that Tableau Prep can do great job of taking well-coded survey data and making it “just so.”
As we see here, Tableau Prep can handle poorly-coded data as well.
Don’t have Tableau Prep? You can download it here.
Want the packaged Tableau Prep Flow explored in this post? Click here to download it.