I came across a terrific blog post from Ross Perez who cites a really clever Tableau technique from Andy Cotgreave.
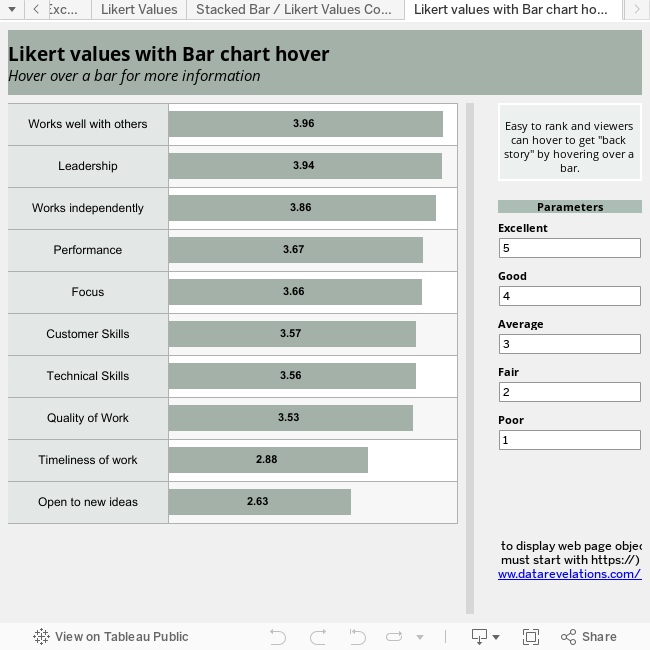
Continuing where we left off with our discussion from The Likert Question Question, in the interactive example at the end of this post we display Likert bars, but allow viewers to see the details by hovering over a bar. In this case, we’re using Andy’s clever hack to embed a bar chart inside the tool tip.

Bar chart tool tip hack
I find this very useful if I have dozen of rankings, as I do with a client that has to provide rankings for 50 states. In that case the combination of stacked bars and Likert values is overwhelming, but Likert scores with the tool tip hack works great.