September 20, 2017
Overview
As anyone who has read anything on my blog that relates to survey data knows, the number one impediment to success with Tableau is getting your data “just so.”
Until recently I recommended two different approaches. You can either use Alteryx and have a rock solid, robust, fully-featured, (and expensive) solution or you could have a somewhat rickety, cumbersome, free solution using cross-database joins in Tableau.
Thanks to the advice of fellow Zen Master Rob Radburn, I now know about a third alternative, EasyMorph. Based on my brief time working with the product, EasyMorph appears to be solid, robust, full-featured, and costs somewhere between free and not-at-all expensive.
In this blog, I’ll show you how to take the same data set I use in all my classes and get it setup so that it works perfectly with Tableau.
Working with EasyMorph
Using the same data set I discuss in the general “here’s how your data needs to be setup” blog post, let’s see how we’re going to get the data-as-numbers, the data-as-labels, and the helper file to all play nicely in EasyMorph.
Importing and Reshaping the Label Responses
Here’s the EasyMorph Start page. Let’s begin by importing the Label responses from Excel.
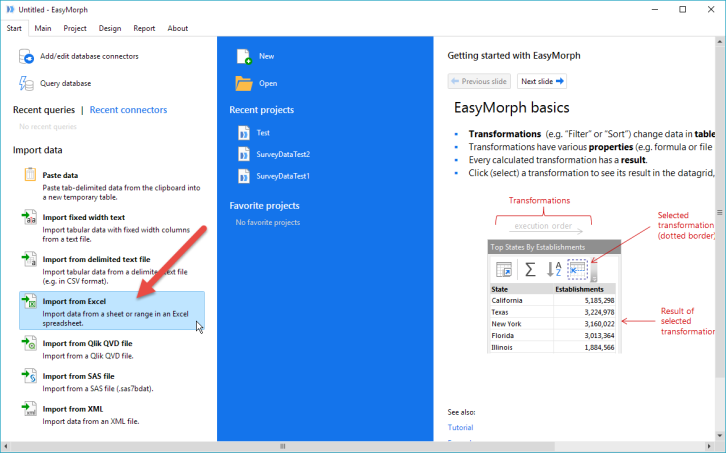
Figure 1 — EasyMorph Start page. Yes, we’re importing Excel files but we can also connect to databases.
Here I indicate that I want to open the Excel workbook and then tell EasyMorph which tab in the workbook I want to use.
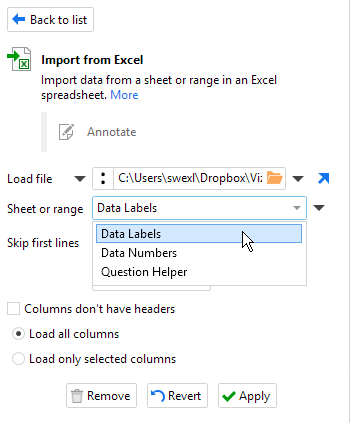
Figure 2 — Specifying which sheet in the Excel workbook I want to use, in this case Data Labels.
Clicking the Apply button will apply this “transformation”, where a transformation is just an action I want to have happen in my workflow. EasyMorph will then display the data in its main workspace window, as shown below.
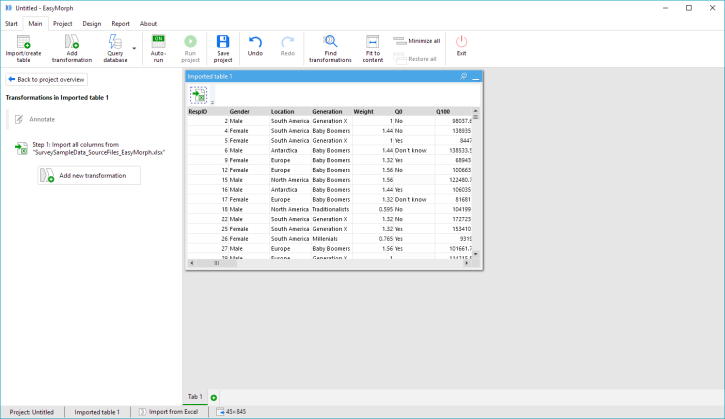
Figure 3 — The Excel Data Labels tab imported into EasyMorph.
We now need to specify which columns we want to leave intact and which we want to reshape. We can do this by adding an Unpivot transformation.
I’ll start by clicking Add New Transformation…
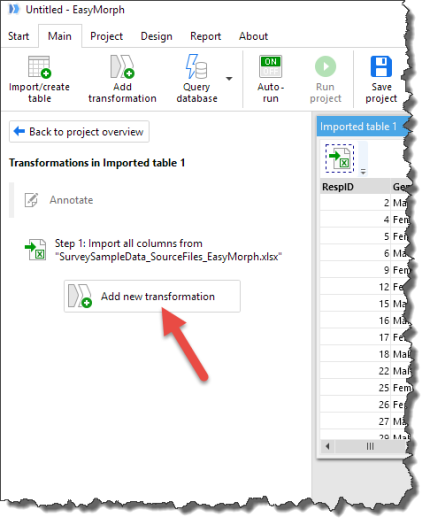
Figure 4 — Adding a new transformation
… then I’ll click the Advanced menu and select Unpivot from the list, as shown here.
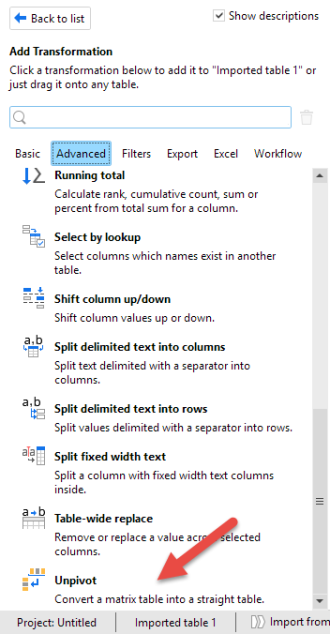
Figure 5 — Not the most obvious place to find this feature, but this is how you reshape the data (Tableau calls this a pivot; EasyMorph calls it an unpivot. Tomato Tomahto…)
We next need to indicate what we want to call the reshaped fields and which fields we want to leave intact. Here we indicate that we want to leave Gender Generation, and Location intact, but we also need to include RespID and Weight (we need to scroll down to see them.)
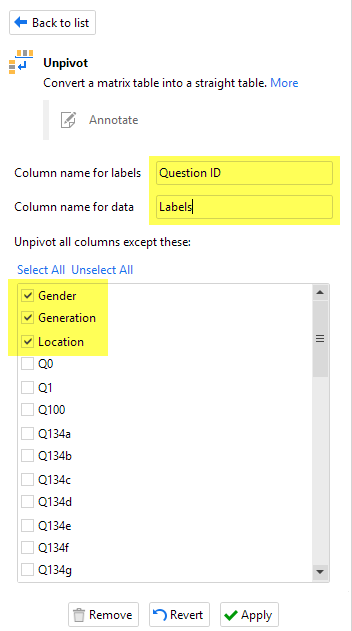
Figure 6 — Specify which fields to keep and which to reshape. Note that the two other fields we need to select are at the bottom of the list.
Next, we need only click the Apply button and we’ve got our demographics and Data Labels set up, “just so.”
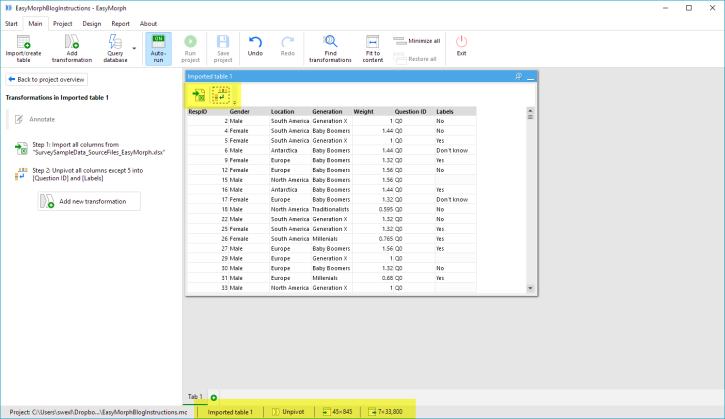
Figure 7 — Our reshaped data. We’ve applied two transformations. Notice at the bottom of the screen we see that we went from 45 columns and 845 rows to 7 columns and 33,000 rows.
Importing and Reshaping the Numeric Responses
We’re now ready to import the Numeric version of the data. We start by clicking Import/create table, indicate we want to import from a file, and select the same Excel file.
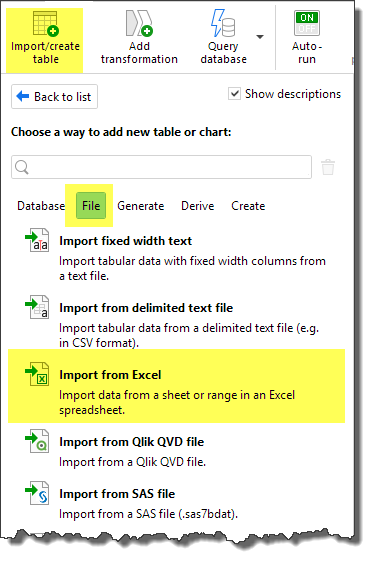
Figure 8 — Inserting a second set of data.
We’ll see the same options as before, but this time we’ll specify that we want to import the Data Numbers tab, as shown below.
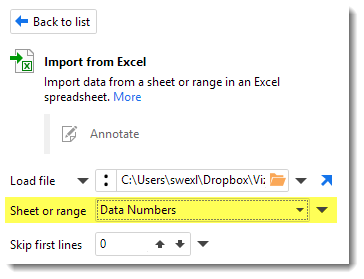
Figure 9 — Importing the numeric version of the data.
Clicking Apply will import the data.
Before reshaping the numeric version of the data, we can remove redundant columns, in this case the “demographic” variables (Gender, Location, Generation, and Weight) as we already have them in the Label version of the data.
We can do this by selecting the columns and selecting Remove 4 columns from the context menu, as shown here. Note that this context menu approach is just a different way to create and apply a transformation.
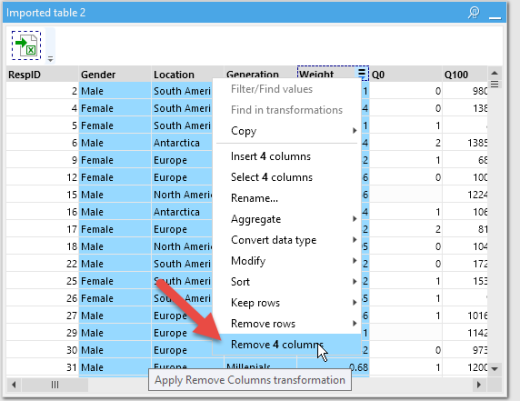
Figure 10 — We don’t need to have these columns as they are already present in the other data set.
We’ll now Unpivot the data, leaving RespID and renaming the columns, as shown below.
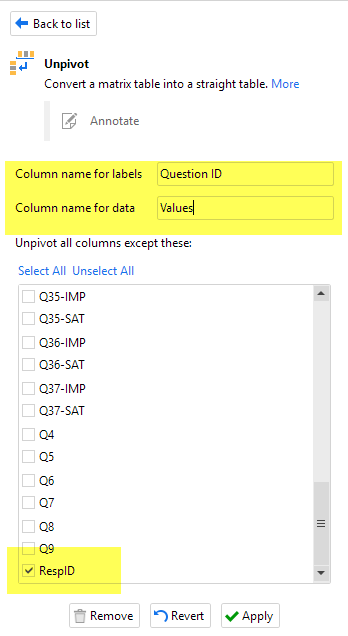
Figure 11 — Reshaping the numeric version of the data.
Joining the Two Reshaped Data Sources
We’re now ready to join the two reshaped data sources. We’ll need to make sure that every Quesiton ID for each RespID lines up so we will join the tables on both of these fields.
Start by clicking the first table (Imported Table 1), then select Add new transformation, then select Merge another table from the list of transformations, as shown below.
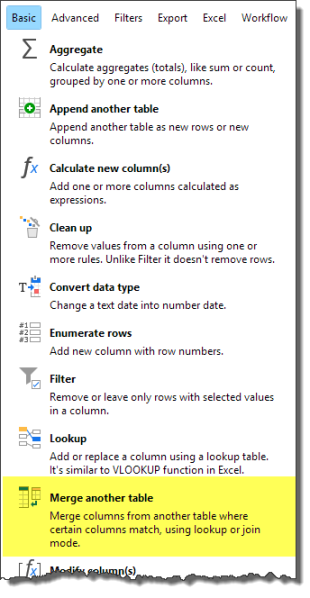
Figure 12 — This is how you do a Join in EasyMorph.
By default, EasyMorph suggests matching the data based on RespID and Question ID. Note that I only need to bring in the Values field from the second table, as shown here.
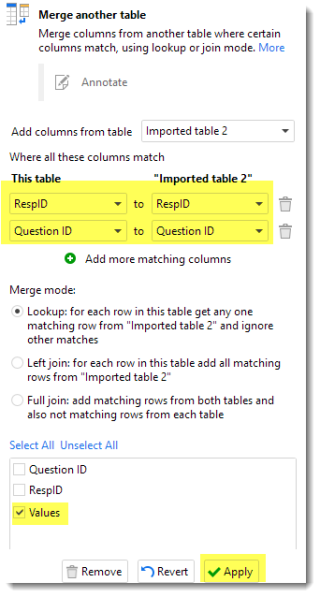
Figure 13 — Selecting which fields to join and which columns to combine from the second data source.
Clicking Apply will append the Values column from the second data source to the first data source.
Adding the Helper data to the mix
We’re now ready to import and join the “Helper” data. This will map each Question ID to its human readable form and groups related questions together.
Start by clicking Import/create table, then indicate that you want to import from a file, then select the same Excel file.
We’ll see the same options as before, but this time we’ll specify that we want to import the Question Helper sheet, as shown below.
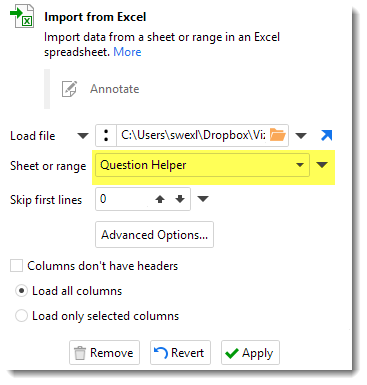
Figure 14 — Importing the Helper data.
We’re now ready to merge the Helper data with the combined numeric and label data.
We start first by selecting the main table (Imported Table 1) and selecting Add new transformation.
We then select Merge another table and indicate we want to add columns from Imported table 3, as shown below.
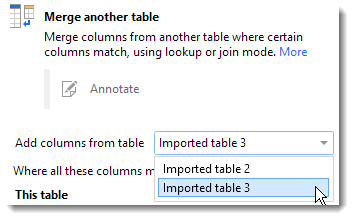
Figure 15 — Selecting which secondary table to merge.
We now need to specify which fields to use for the join and which columns to combine. Note that the field names are different so EasyMorph didn’t automatically join on Question ID.
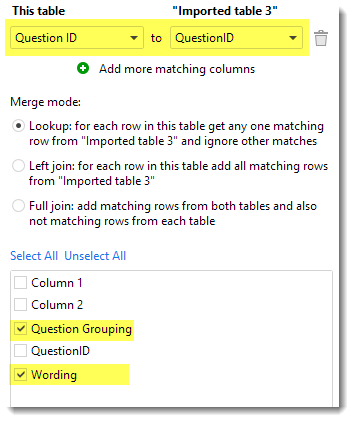
Figure 16 — Specifying the Join field and which columns to combine. Here we join “Question ID” with “QuestionID.” Hey, who says I don’t show “real world” examples?
Clicking Apply will combine all the relevant data into the main table, as shown below.
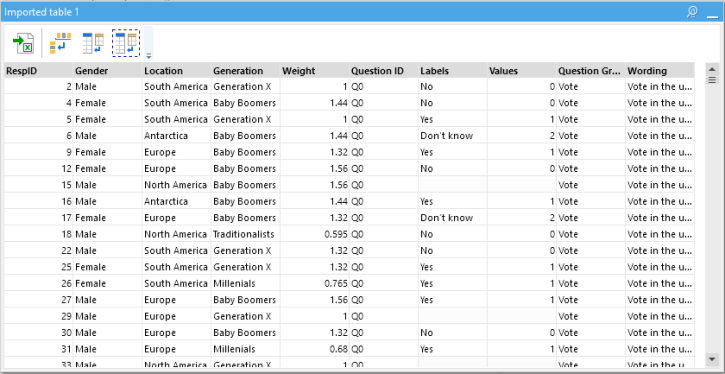
Figure 17 — All the data, combined correctly.
Notice the icons along the top of the window indicating that we’ve performed four transformations on this table. Selecting an icon will show the settings you specified for the selected transformation.
Not convinced the data is “just so”? We can sort on RespID and you’ll see all the survey responses for a particular respondent (Just right-click the RespID column and select Sort.)
Exporting the Data to a Tableau Data Extract file (.TDE file)
We’re now ready to export the data so that we can visualize it using Tableau.
We’ll start by making sure the main table is selected and then click Add new transformation.
We then select Export and select Export to Tableau from the list of options, as shown below.
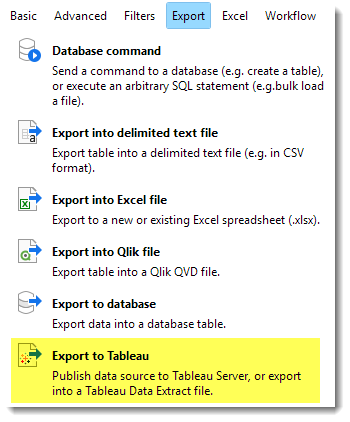
Figure 18 — Exporting the data to a .TDE file.
Clicking Export to Tableau will bring up the Export options, as shown below.
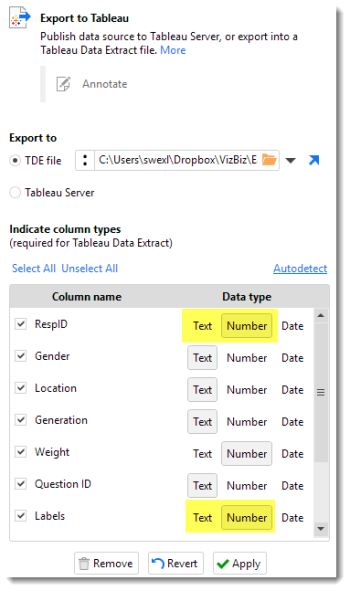
Figure 19 — Exporting to a .TDE file. Note that you can write the file directly to Tableau Server.
Before clicking Apply, indicate that RespID and Labels should be Text fields and not Number fields.
Okay, we’re just about finished; we just need to run the project by clicking the Run project button at the top of the screen.
Want to load the exported .TDE into Tableau? Just click the last transformation icon at the top of the screen, then click the Open file icon, as shown below.
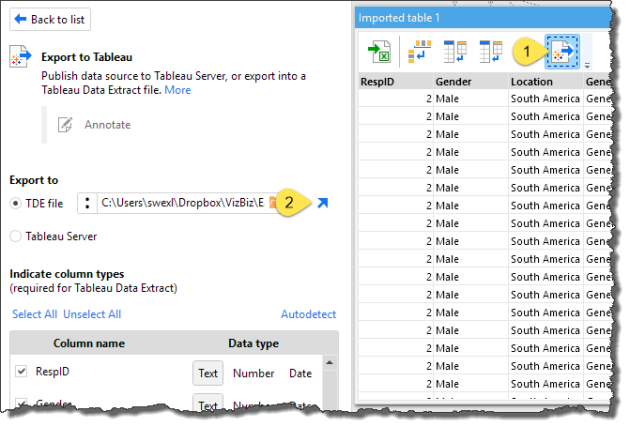
Figure 20 — You can load the exported data into Tableau by clicking the Open file icon.
Below we see what complete data flow looks like. Note that I added a transformation to filter out null values (It’s the second to last icon in the top table). Further note that you can rename each of the tables as you see fit.
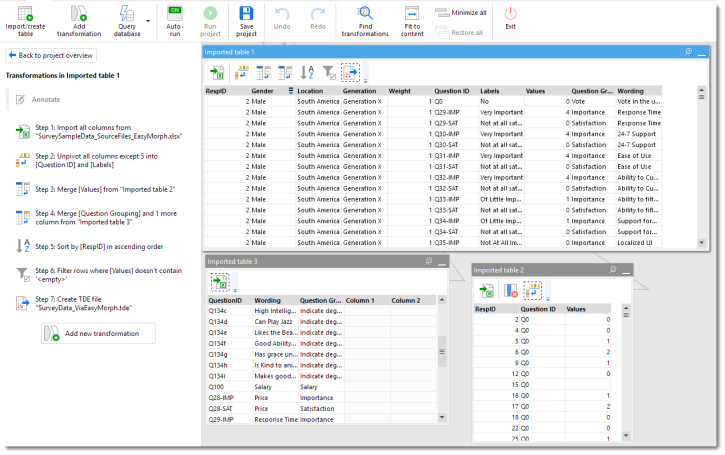
Figure 21 — The complete data flow.
But wait, there’s more!
Assuming your data is coded correctly you’ll probably want to remove null values and labels. No problem, you can just Add a transformation and indicate you want to remove <empty> values.
And what if your data isn’t coded correctly (e.g., check all apply questions are coded using 1s and blanks instead of 1s and 0s)? EasyMorph can handle that, too.
Conclusion
Easy morph was very easy to learn and you can’t beat the price. If you have 30 or fewer transformations in a project you can use the free download (our sample only has ten transformations). Need more than 30 transformations as well as more sophisticated features (e.g., automation and scripting) the price will range from a one-time license of $195 to $55 per month.
EasyMorph also appears to handle large survey data sources without a problem. I was able to convert a monster NPS survey with 3,500 columns and 2,200 rows into a trim ten columns and about 7M rows in just a matter of seconds.
So far, the only downside I’ve seen is that it won’t read SPSS files directly; you’ll need to export to two CSV files, one for numeric-coded data and one for label-coded data.
UPDATE: EasyMorph is great with SPSS files and can read both the text and numeric encoding.
Other than that minor issue the tool has been terrific and I plan to incorporate it into my classes on visualizing survey data using Tableau.
If you need geospatial analysis and predictive analysis in addition to ETL then EasyMorph won’t meet your needs (this is where Alteryx shines). But if you just need solid ETL capabilities, this is a great tool, at a great price.